Chalk Talk Explainer


 +7
Hand Fable 5 your checked facts and the lesson that matters most; a poster, cutaway or set of visual notes comes back, read in one pass down the page.


 and 25+ more agents
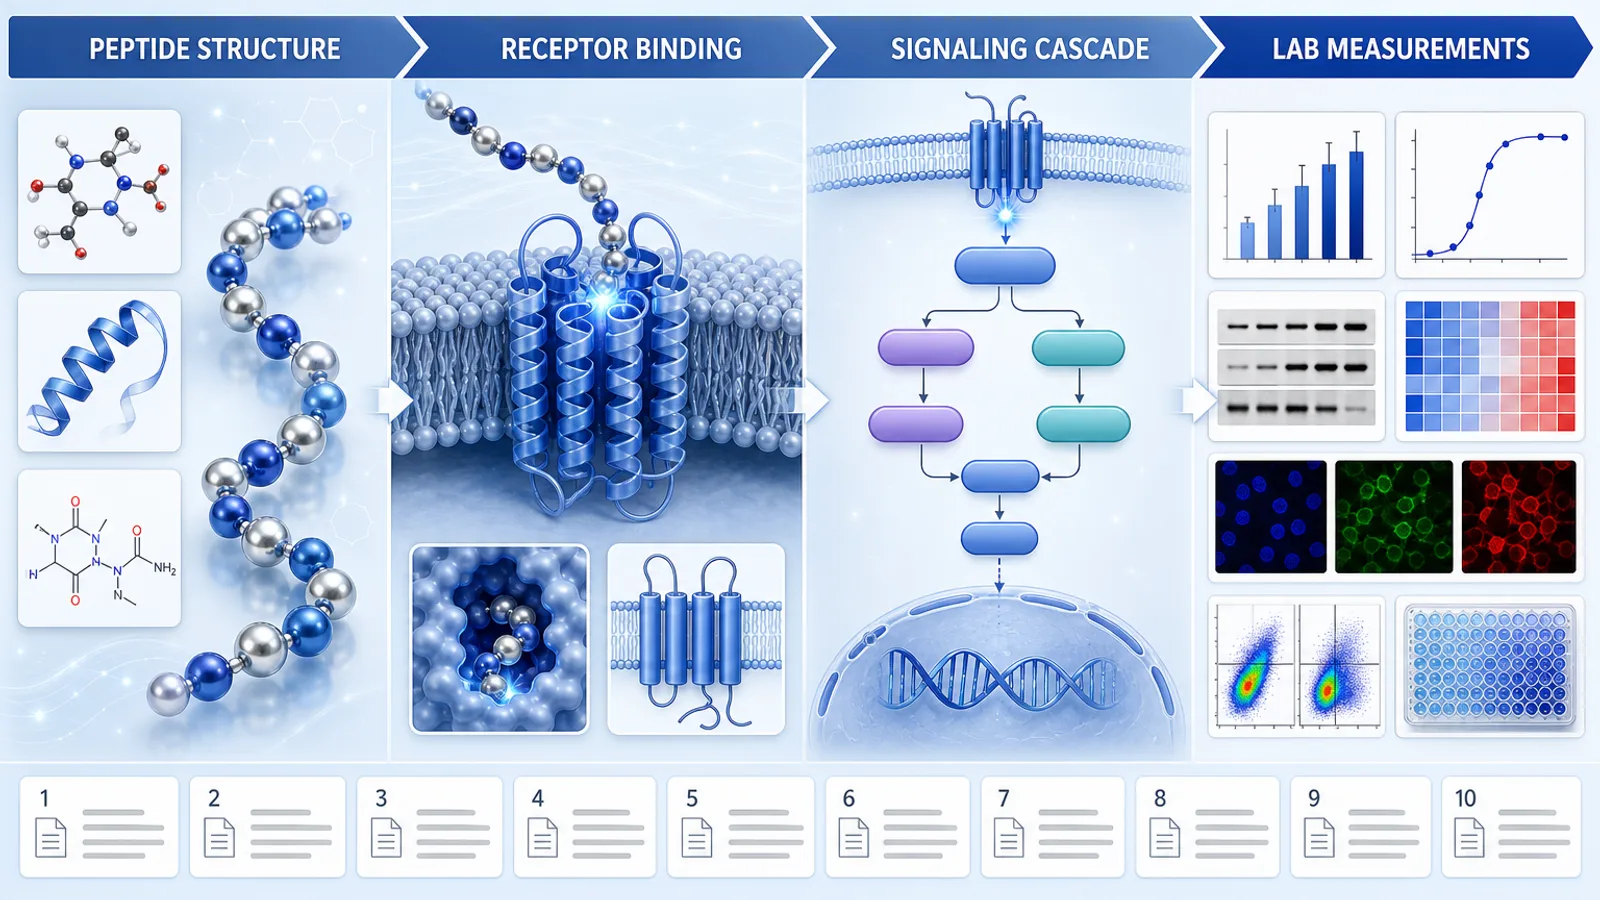
Posters trace a result, cutaways expose what sits inside an object, notes boil a class down.
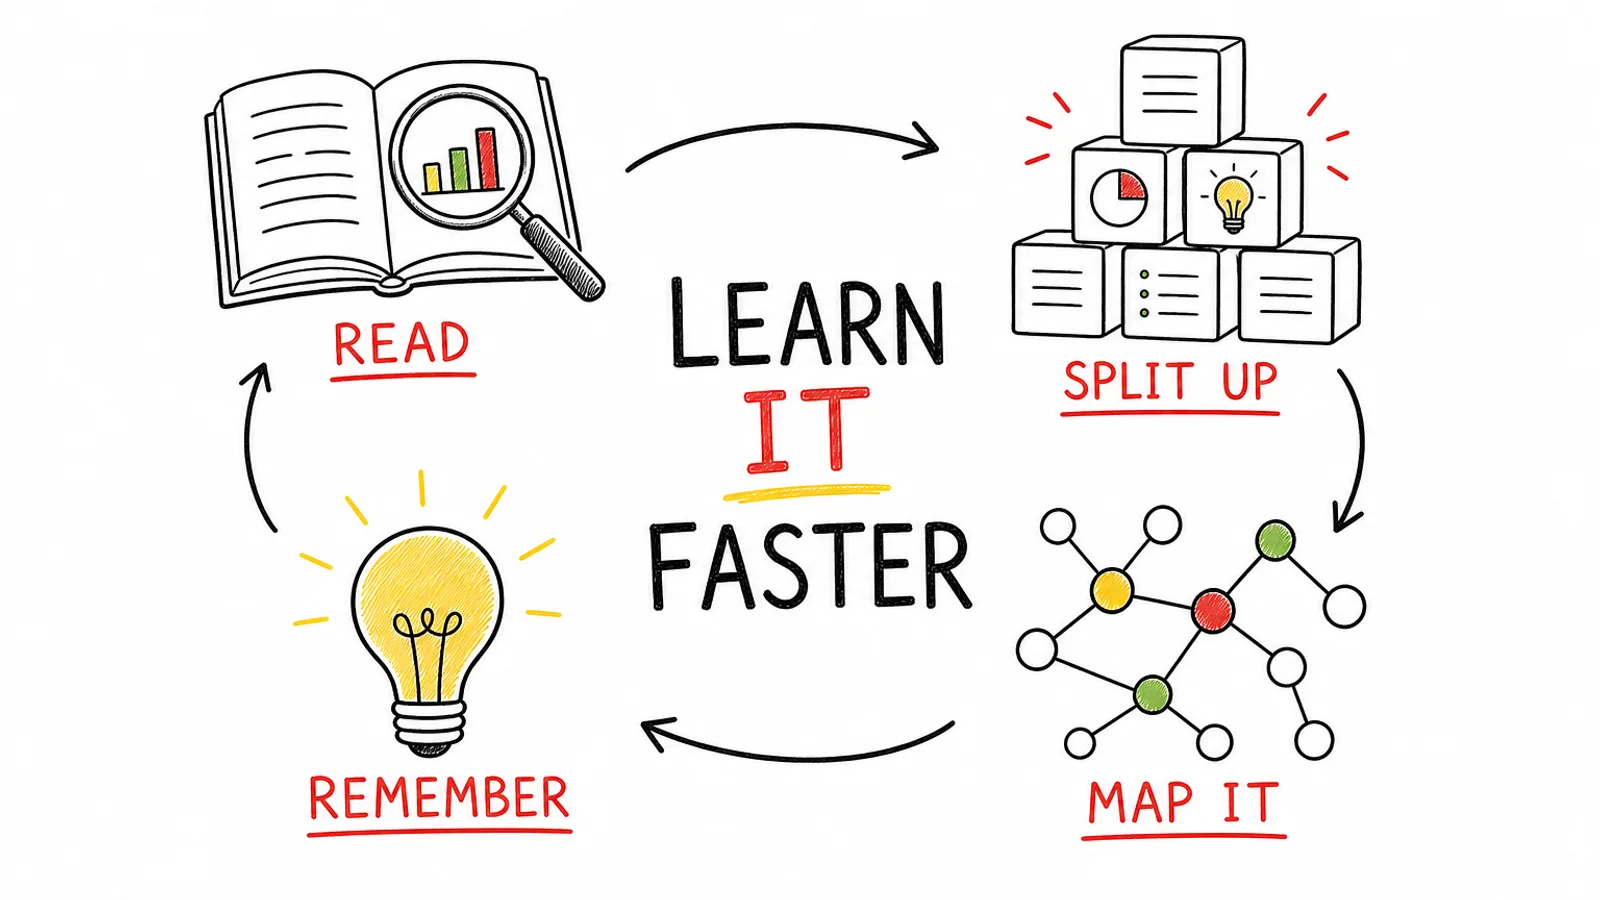
Start from what you want to answer. Posters lead people through a result; cutaways and exploded views open an object to show its parts; sketchnotes compress a class or talk into a single sheet that is good for revision.
 Martha QuinnEarth science teacher, writer2d
The water cycle of one small pond, drawn as a single page. Free for any classroom, print as many as you like.
Infographic posterGenerated text can be wrong or invented. Here, the facts you give stay in charge.

Select a Skill from the list and hand Fable 5 the prompt that installs it.

Write out each word, number and unit that has to appear, and the key lesson.

Look at every label and figure, zoomed in and shrunk down, then share.
A plain request gives you one result. A Skill adds the recipe and the checks that make it repeatable.
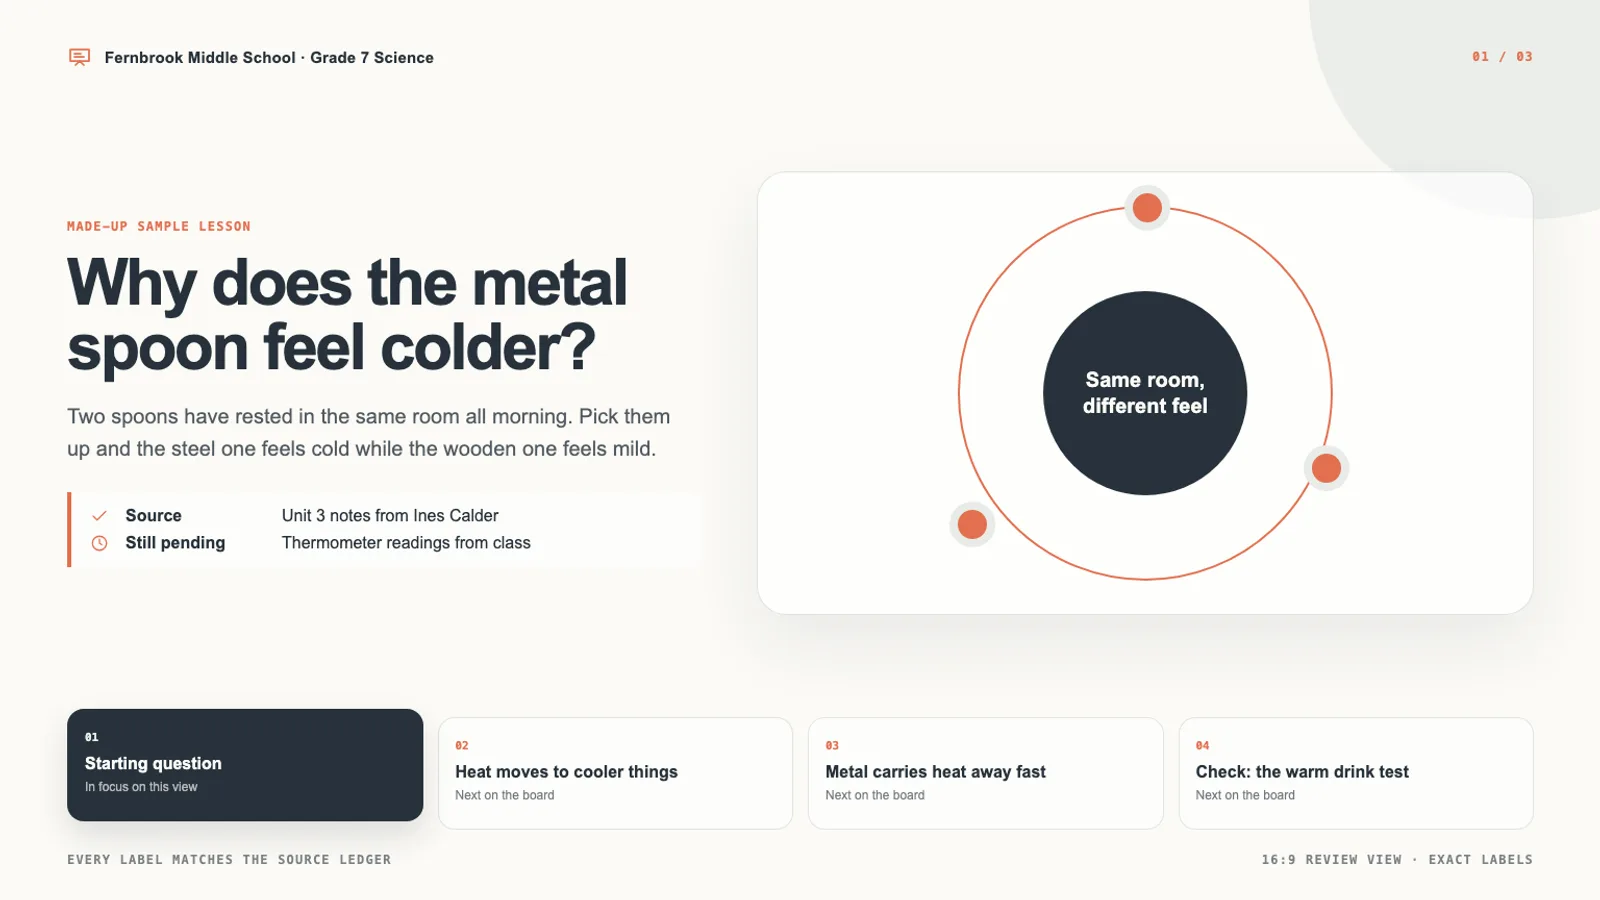
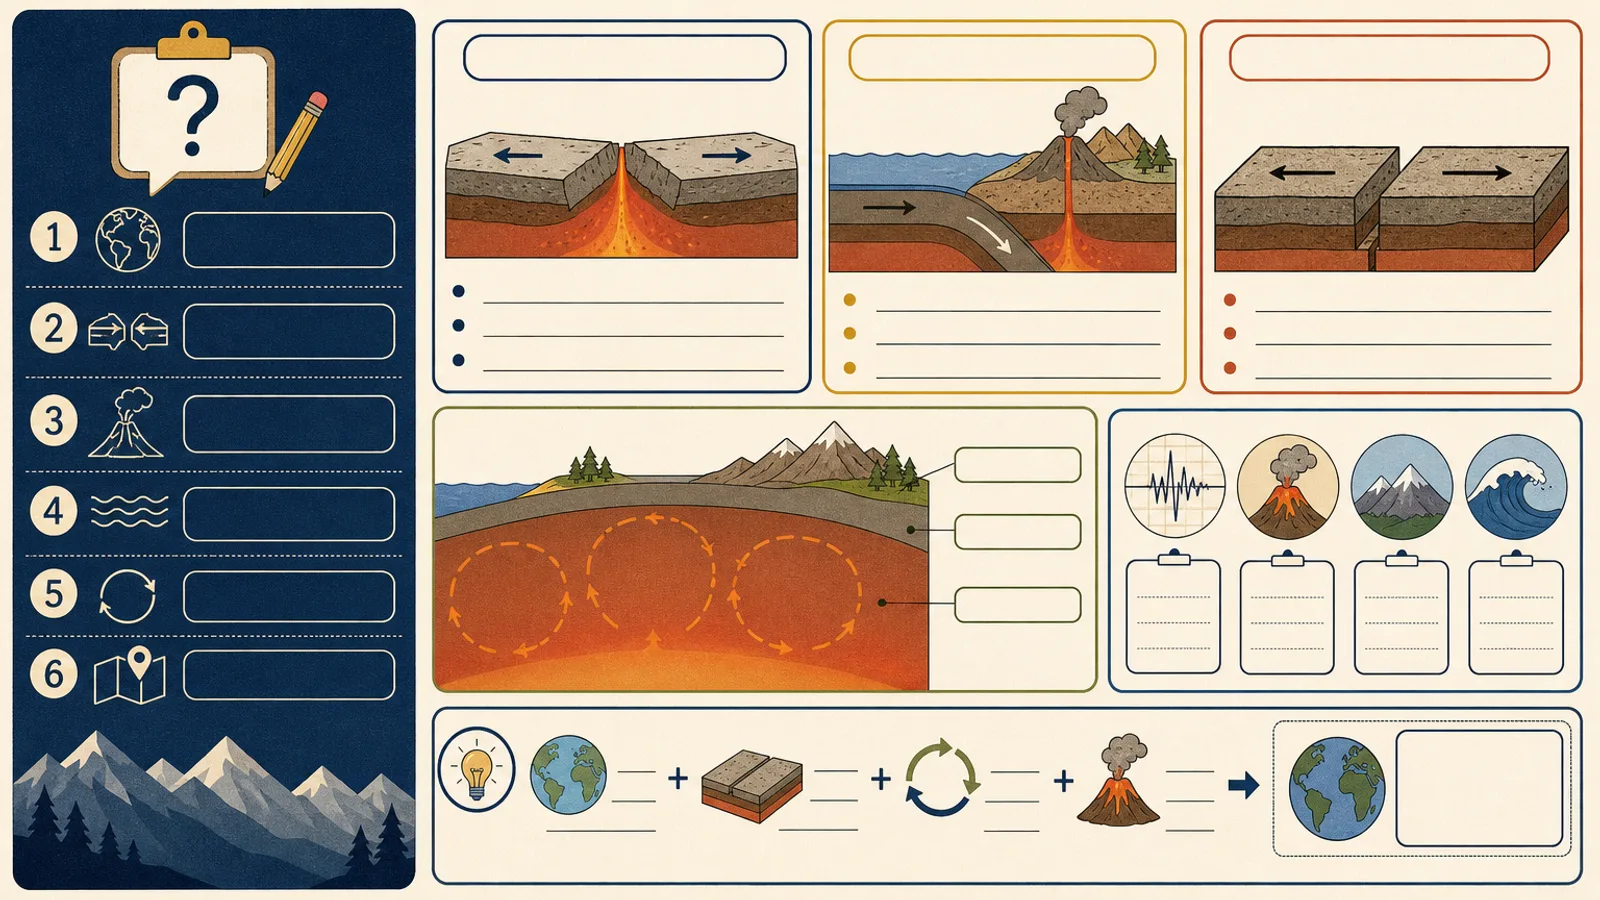
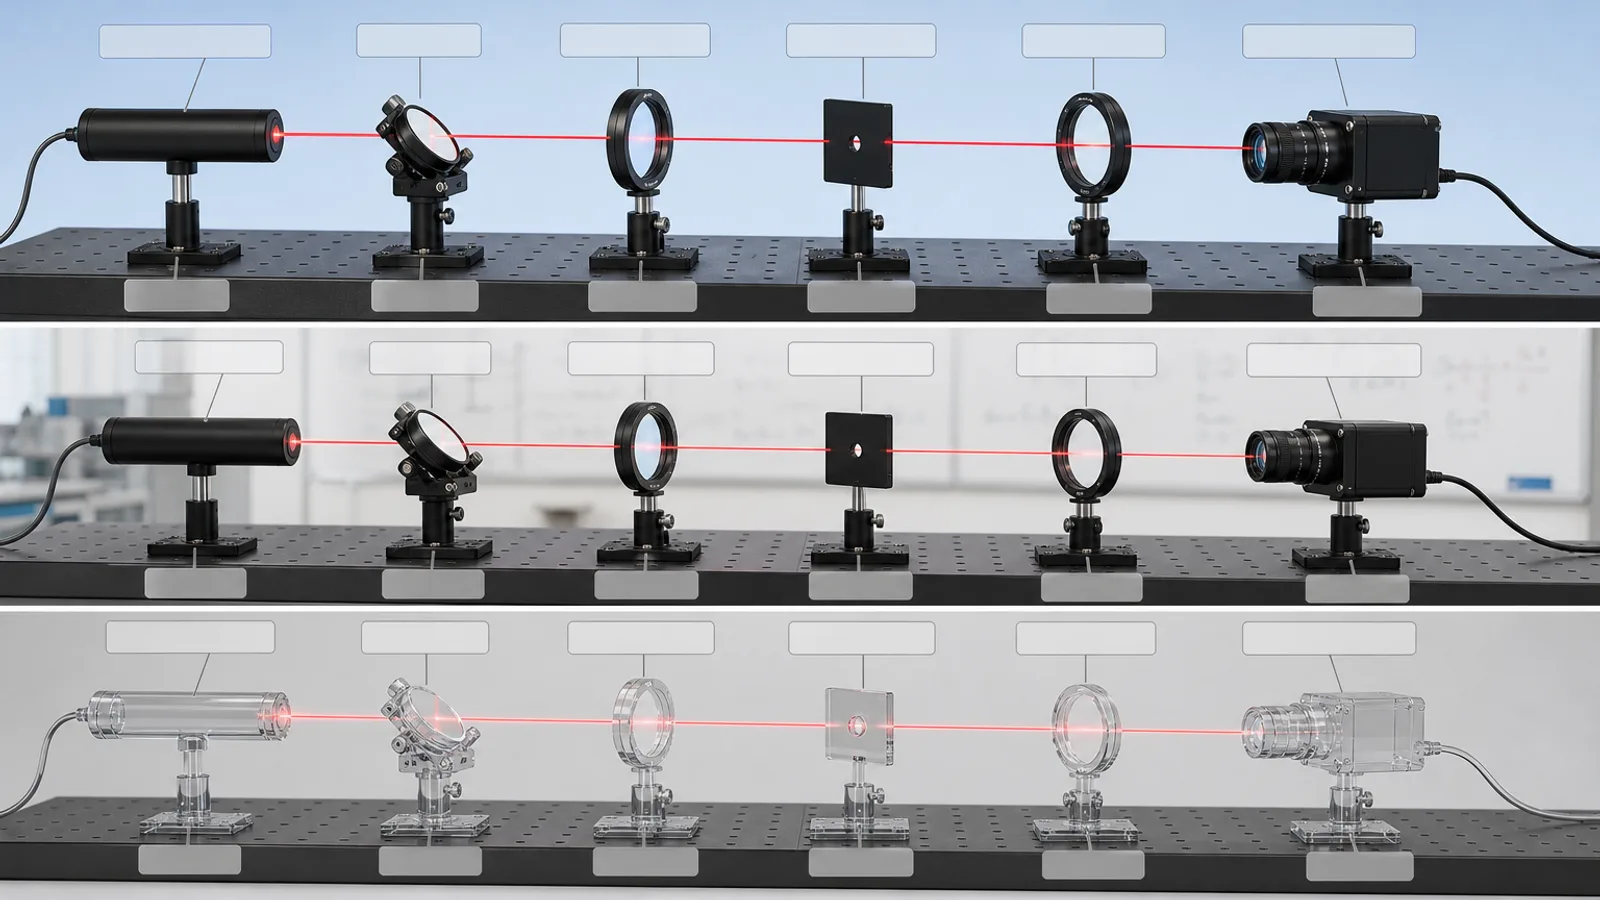
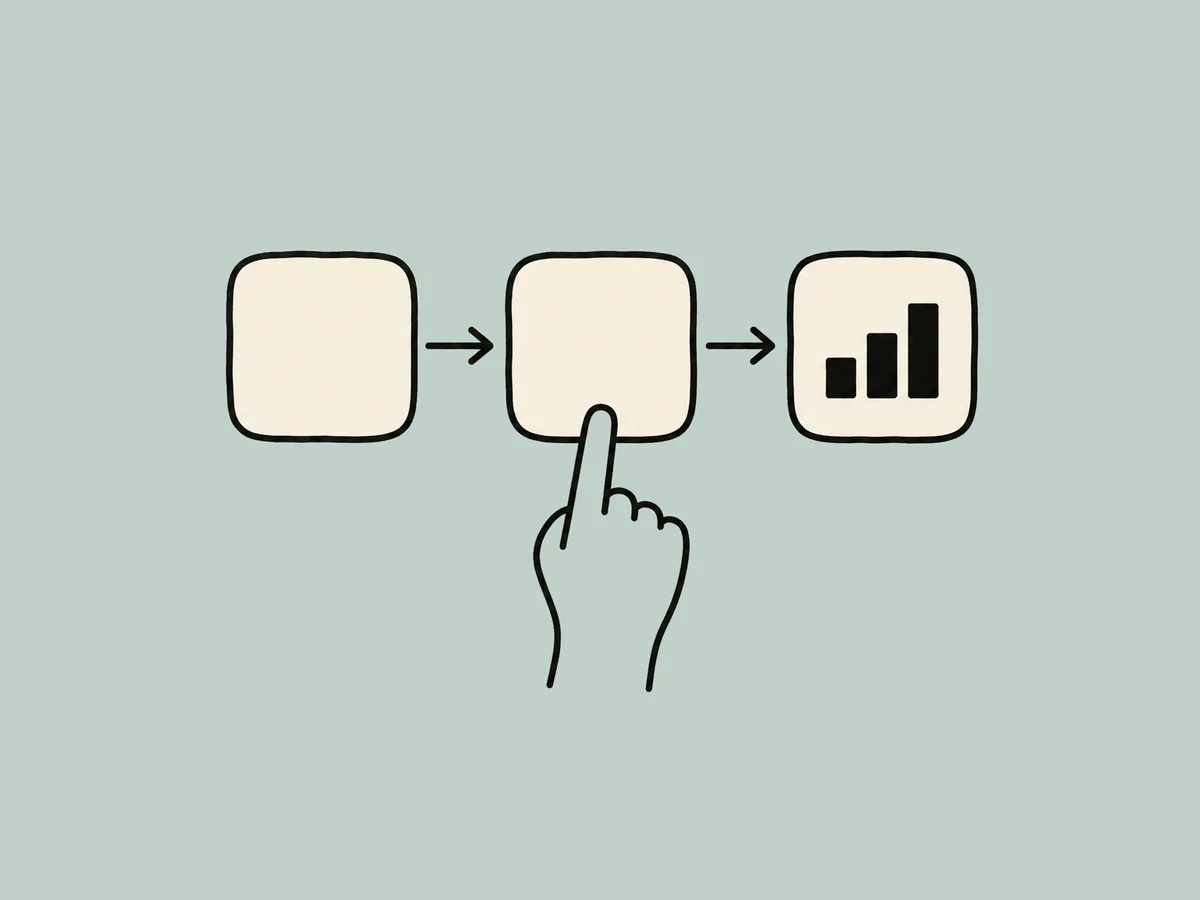
One lesson, one route for the reader, brief labels. Chalk Talk Explainer ships six layouts, covering cycles, processes, side-by-side comparisons, timelines and more, so the structure follows your topic.
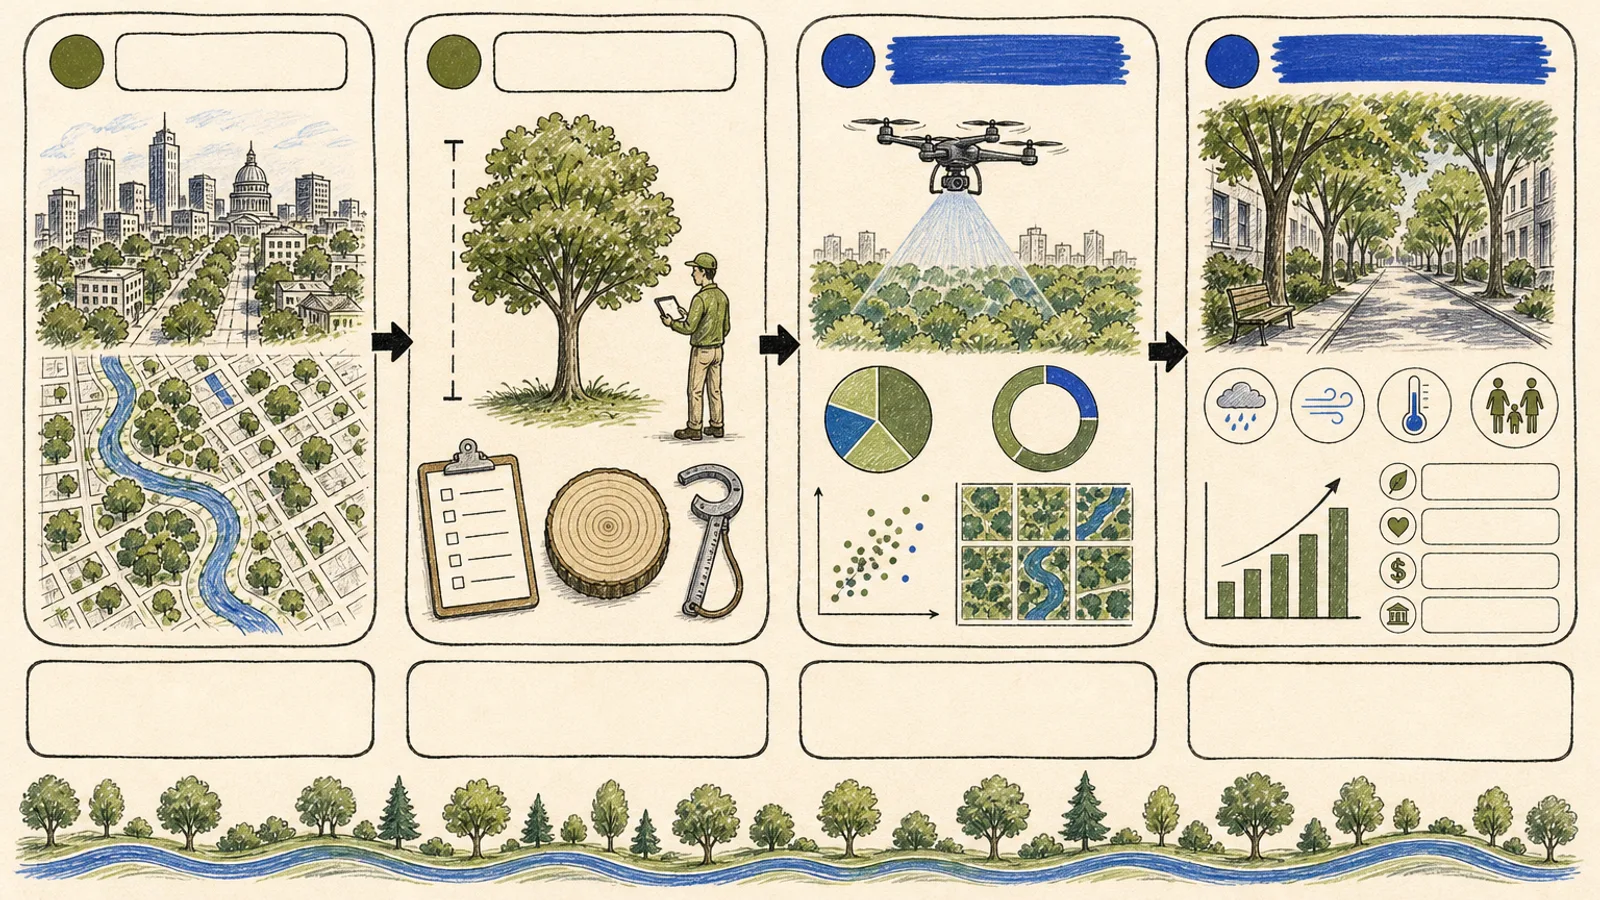
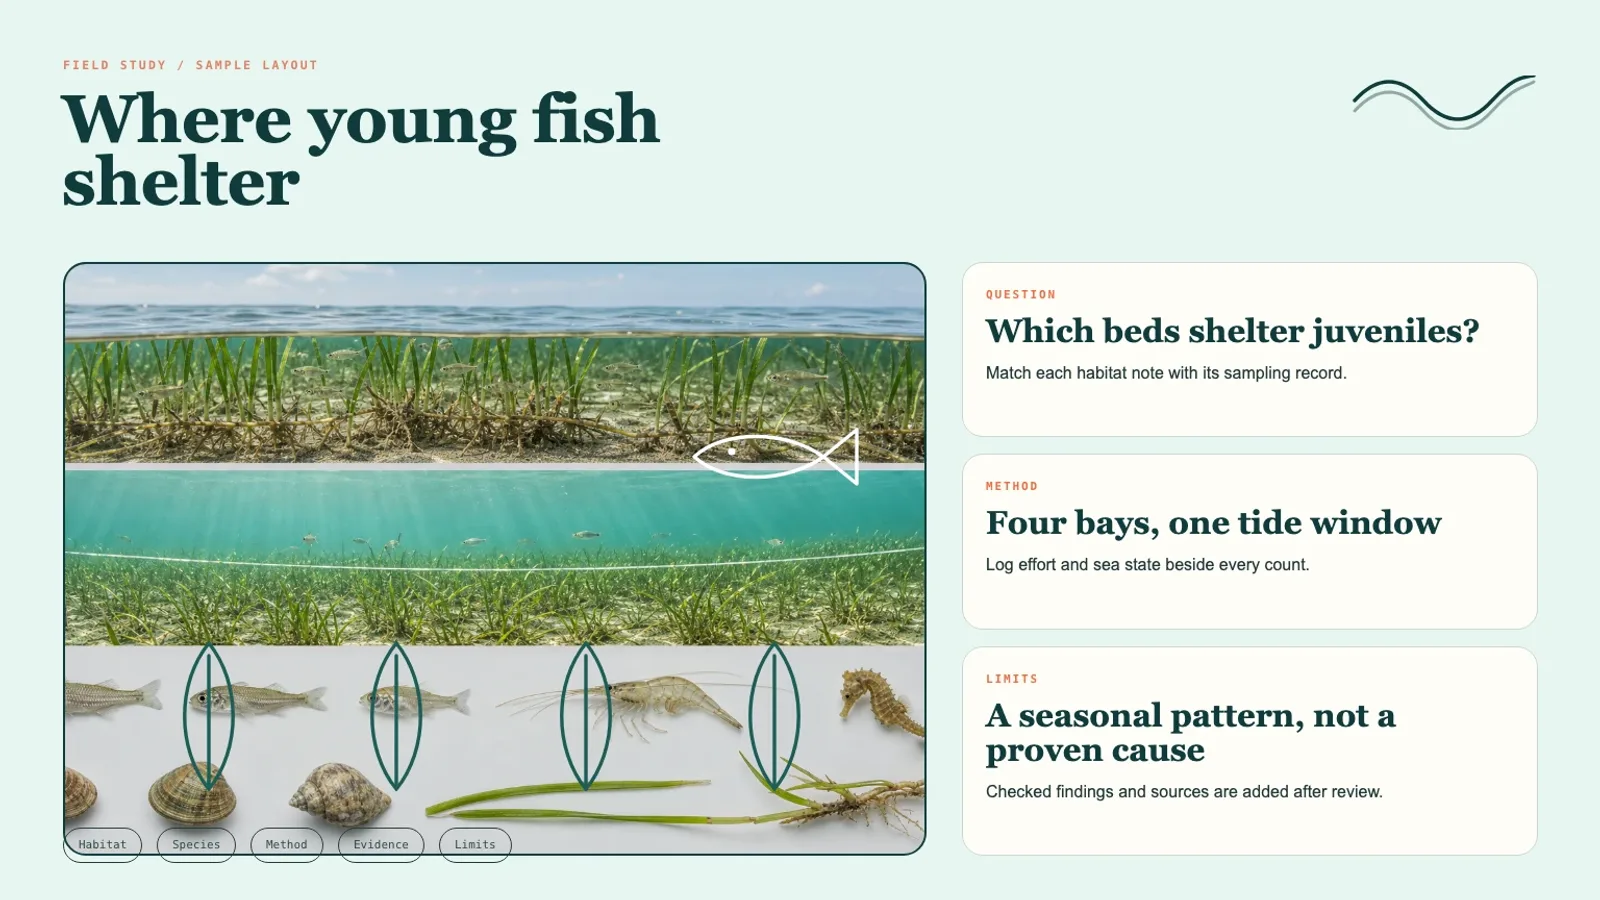
Ocean Field Study Poster lays out a wide landscape poster from findings you have verified, with room for habitat, method, evidence and the open questions. Supply approved sources first; results and numbers are never invented.
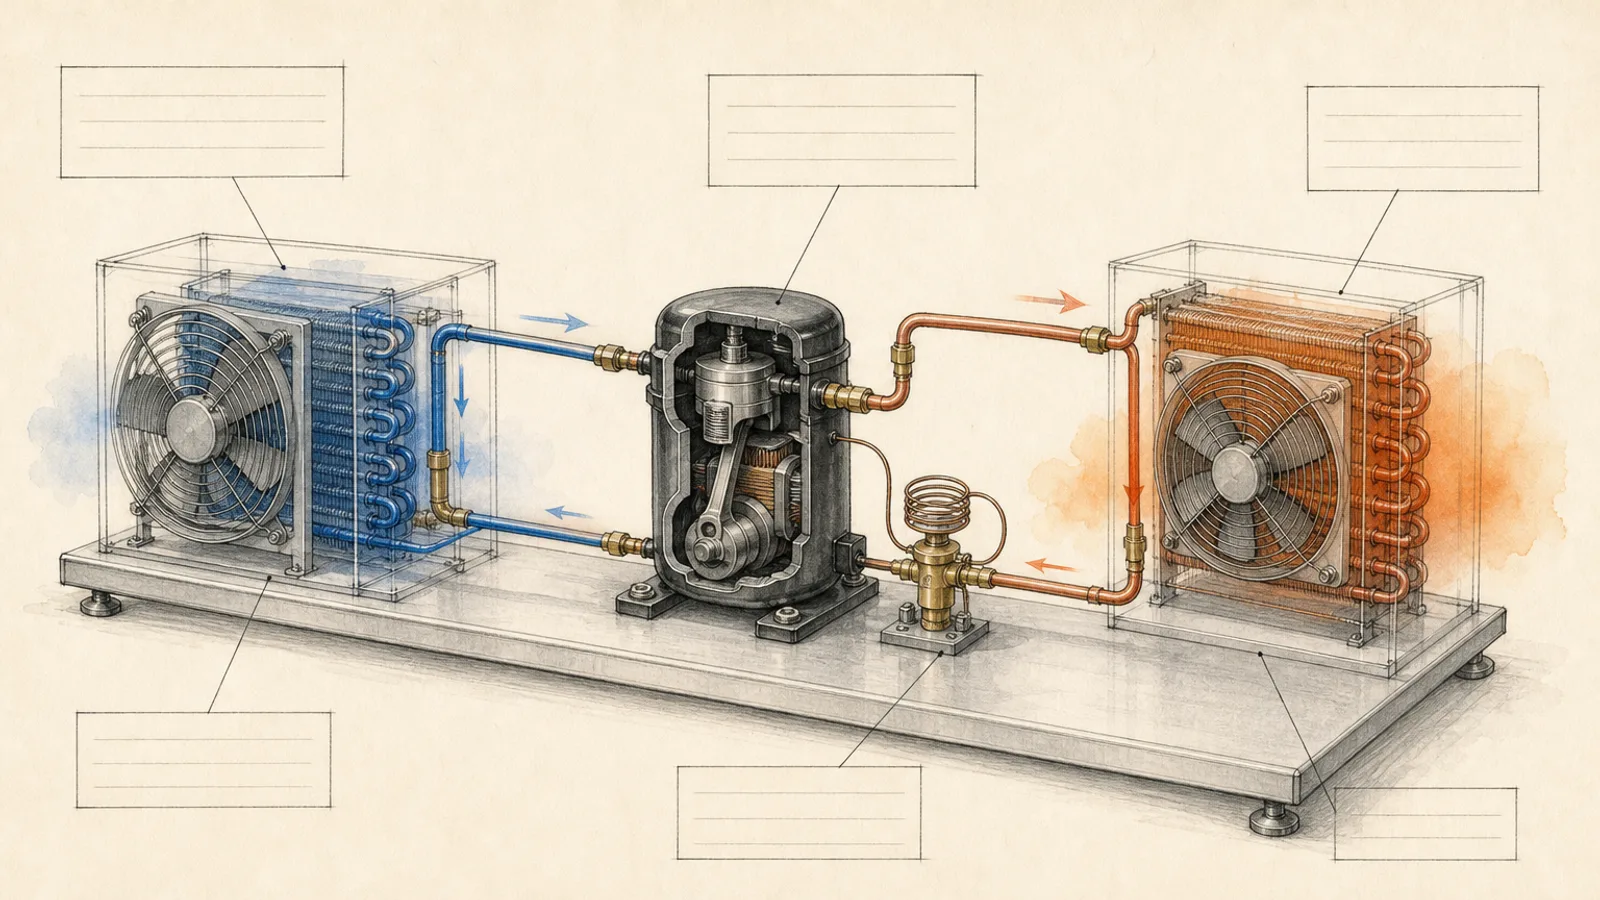
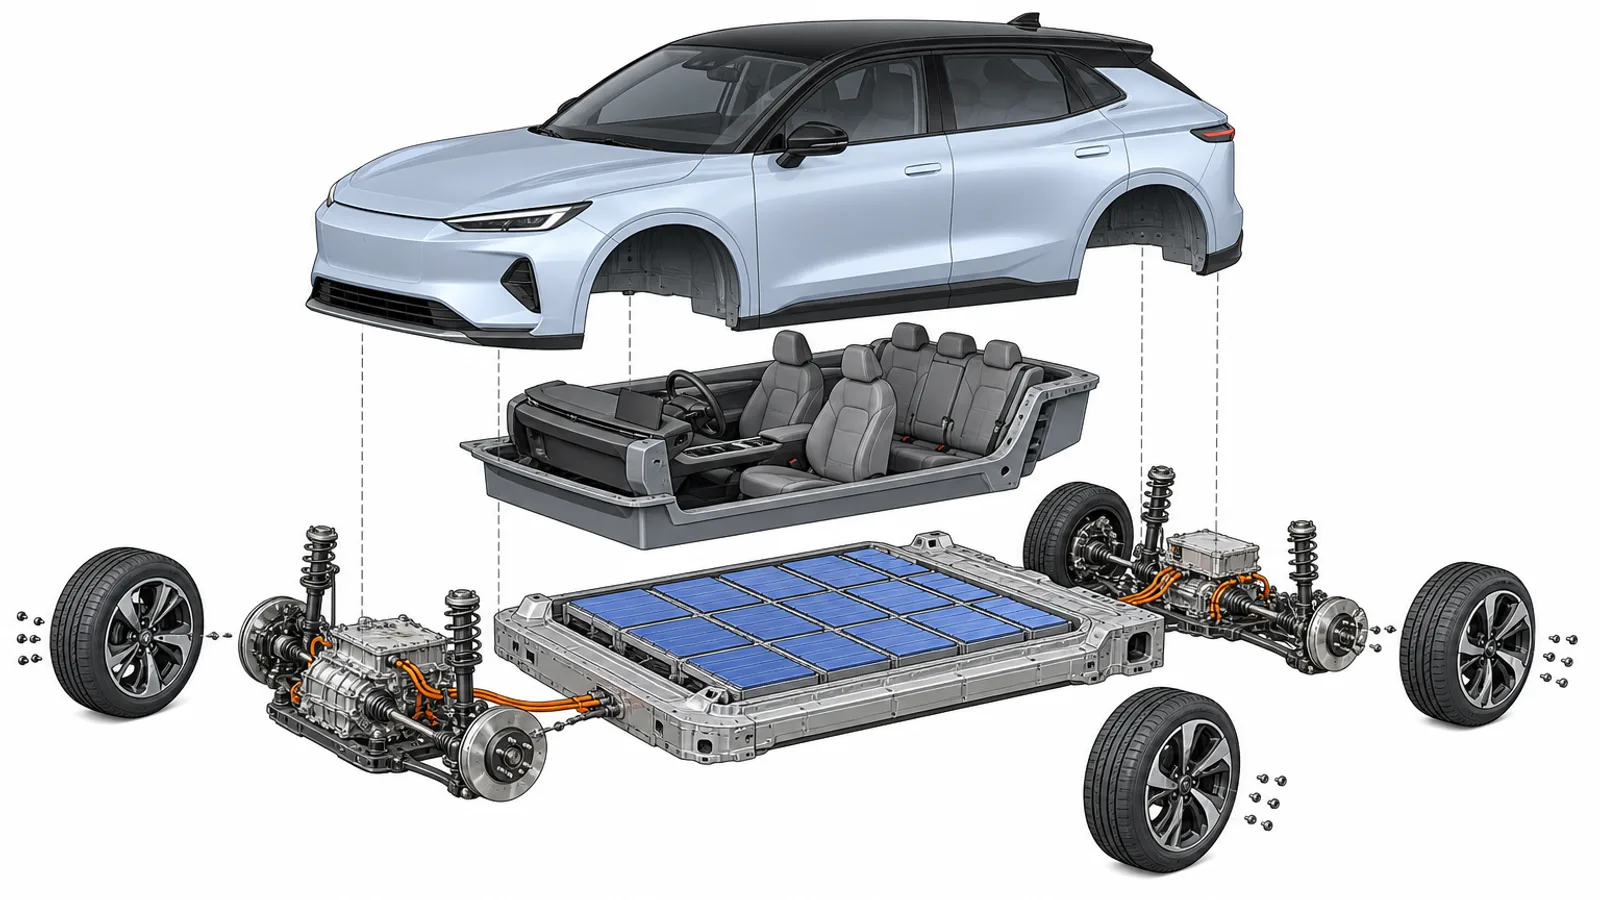
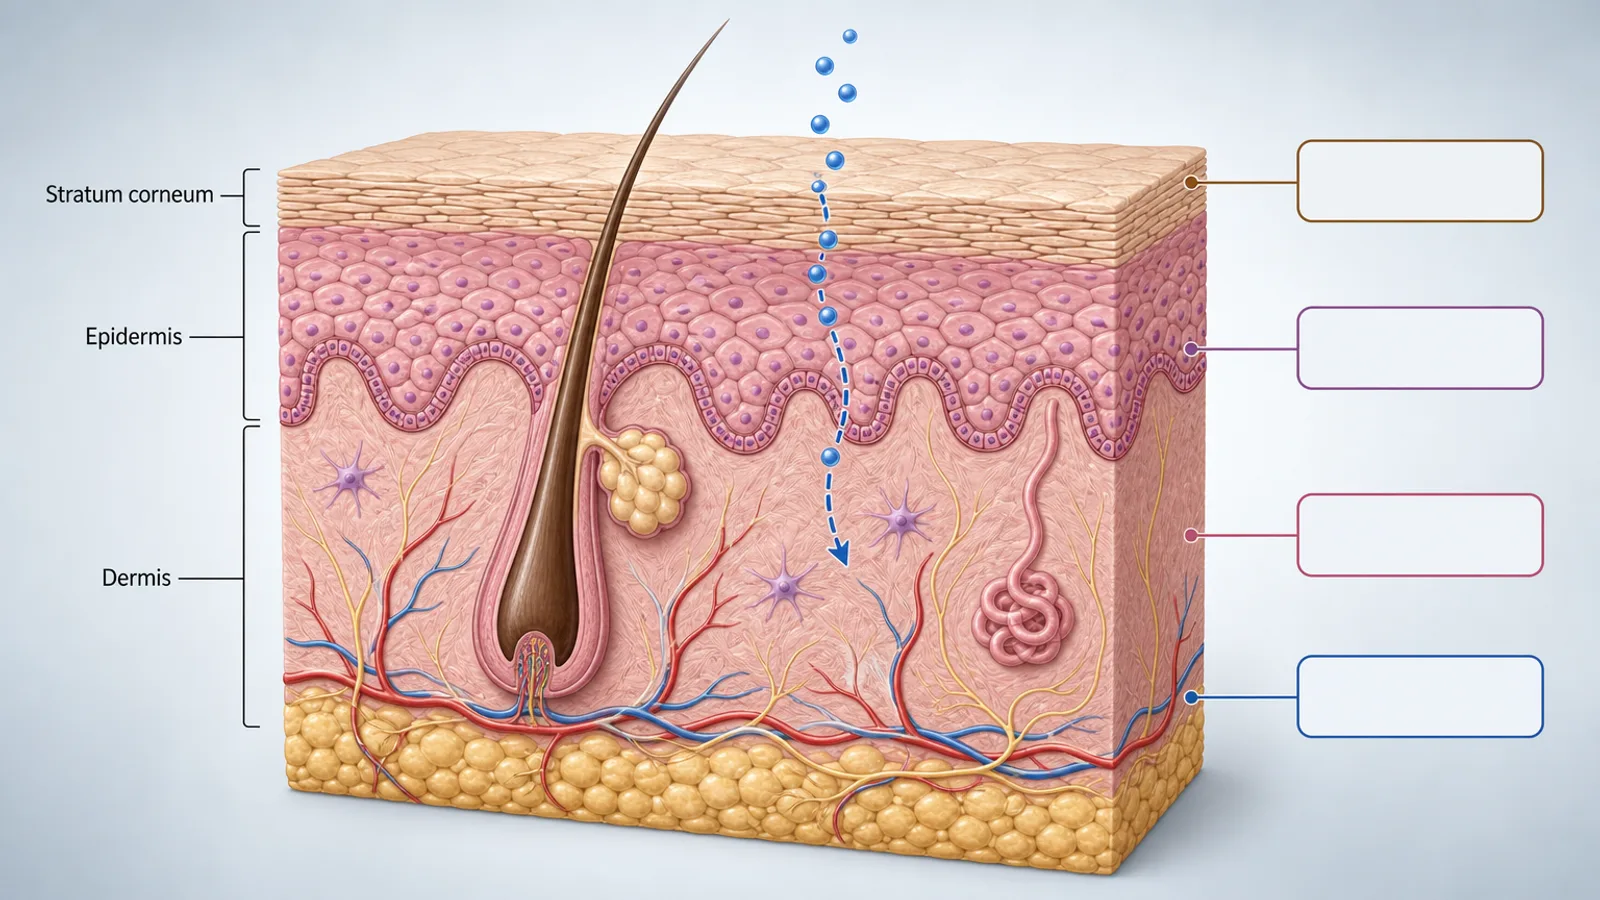
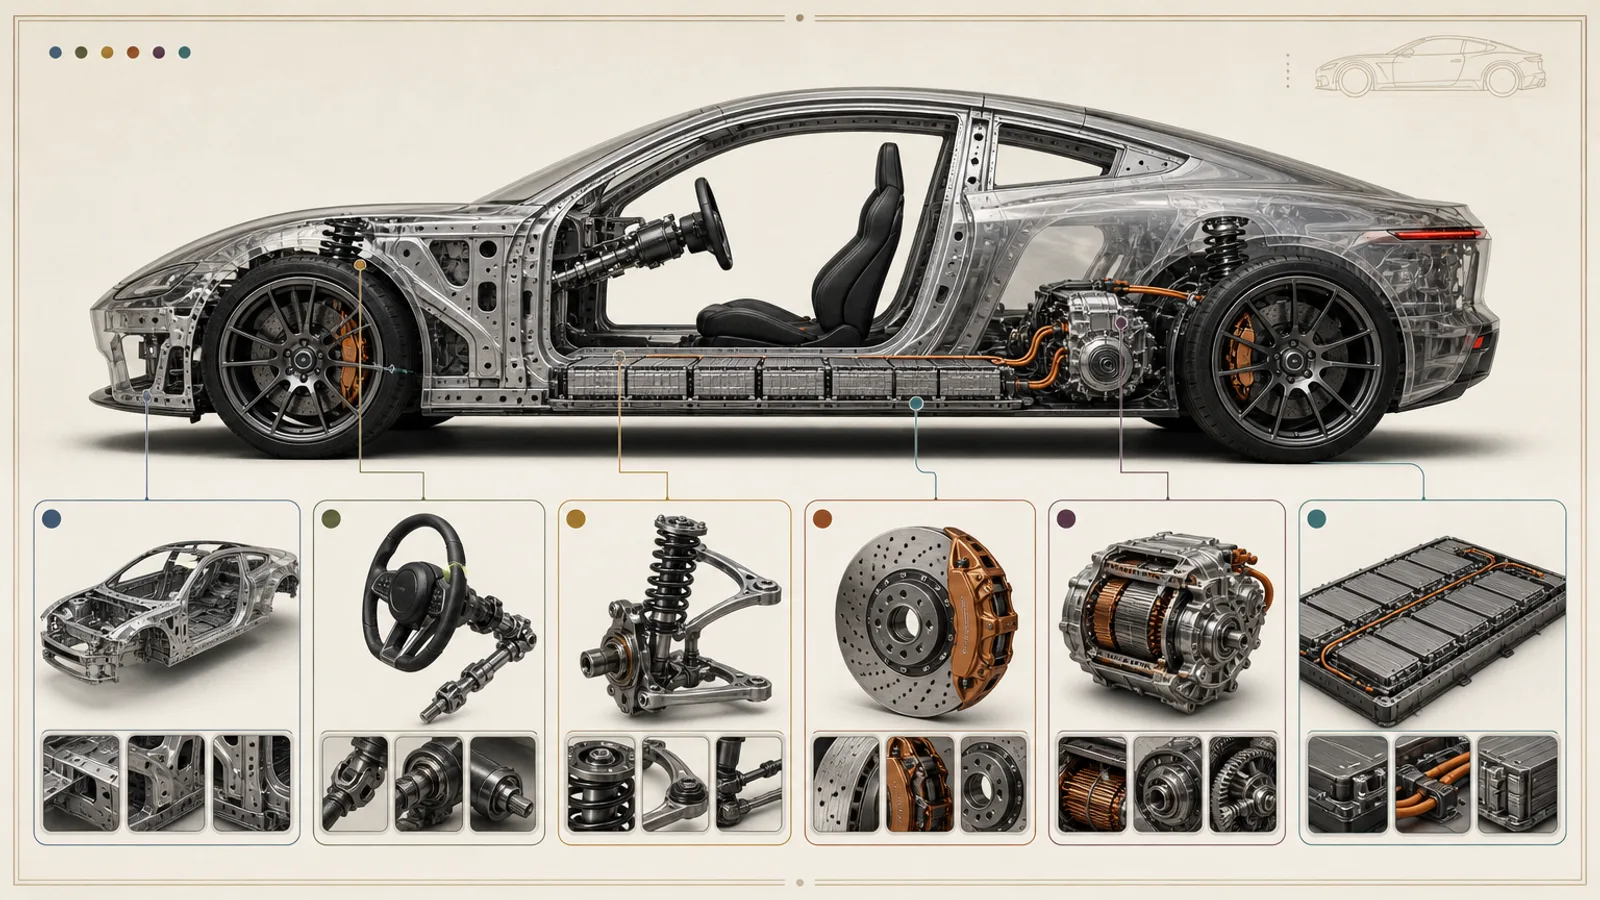
A picture where the parts of an object are drawn pulled apart along their axes, so a reader sees how every piece fits with the next. Electric Car Systems Breakout and Material Stack Cutaway draw images like this for teaching and explaining, never as a repair or assembly guide.
All are $4.99 or in Pro. Most call FAL on your key, paid per picture; Lesson Board Explainer outputs HTML and needs no key.
Watercolor Mechanism Diagram is the one. Gentle watercolor washes meet crisp lines, and the callouts you give are planned in advance, so each label can be checked against exactly what you wrote.
Every job has its own Skills, worked examples and answers.