Marker Sketch Infographicv1.0.0
Use this Skill to make explainer graphics.
Dense findings, one warm hand-drawn page: a teaching infographic skill for Claude Fable 5 in loose marker and ink on cream paper, with blank boxes for your exact labels and sources.
Picked most often by
Updated Oct 30, 2026
Preview gallery


 FAL
Similar Skills
View all
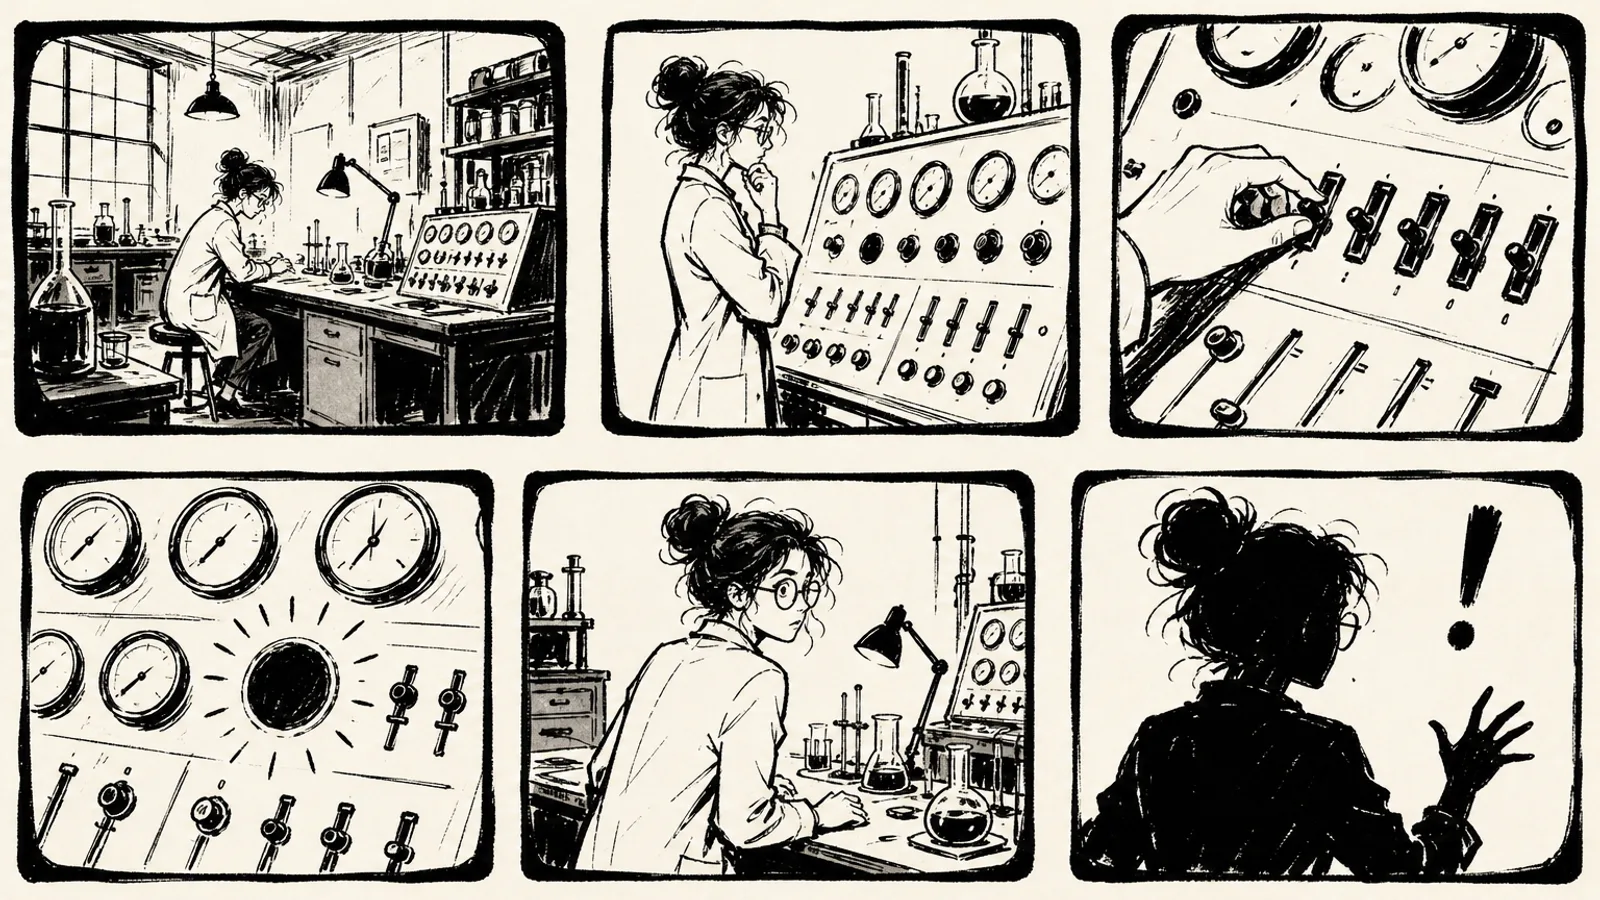
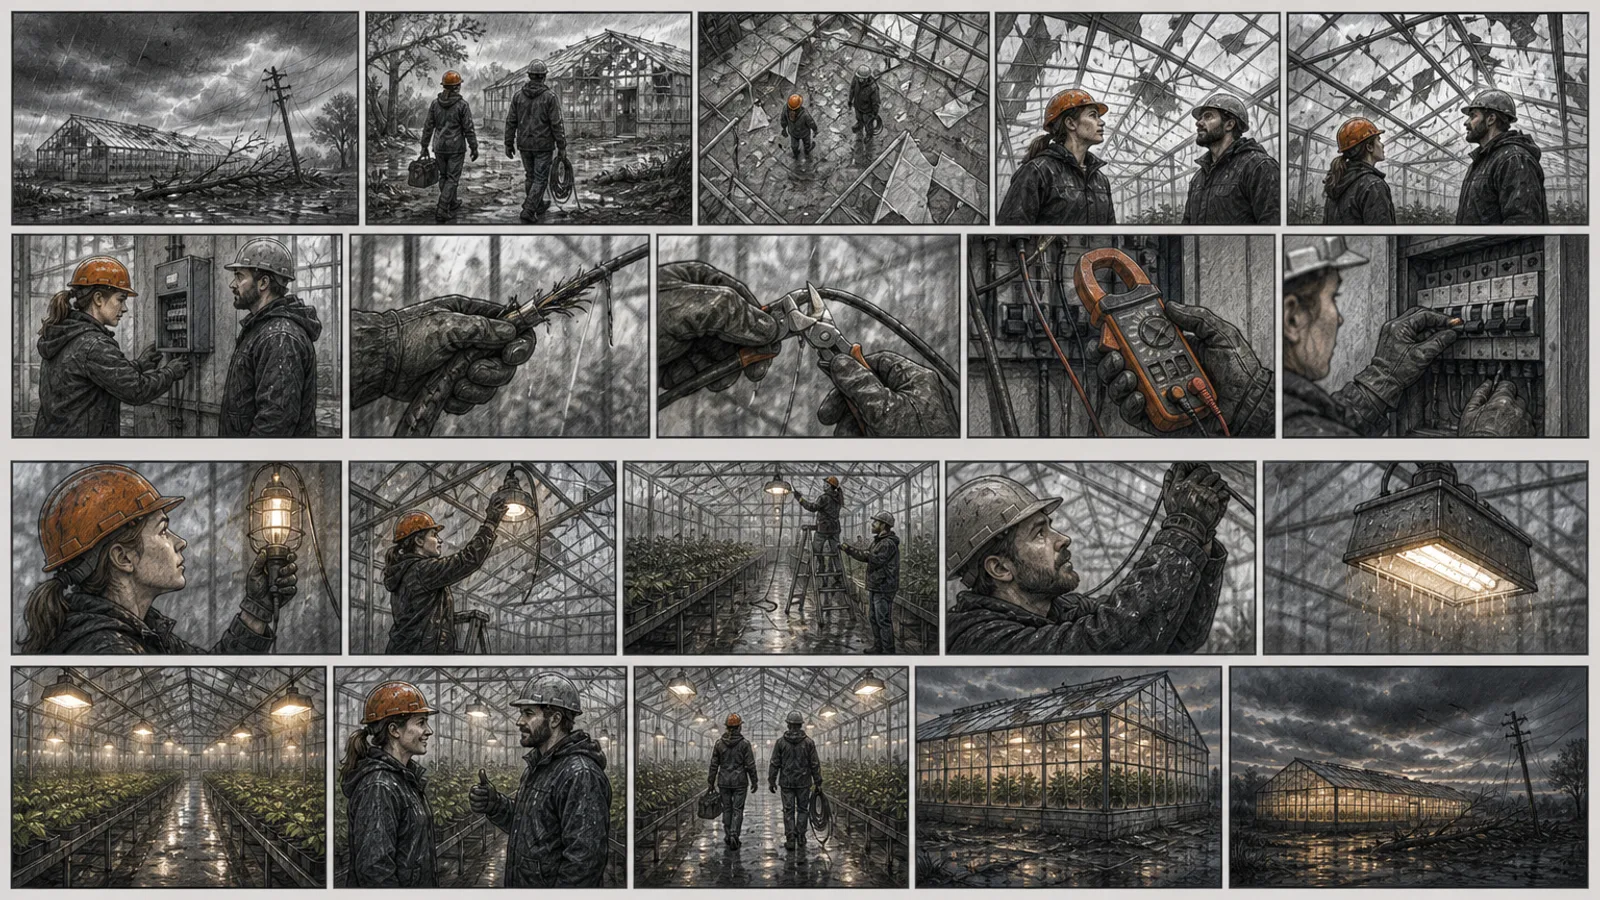
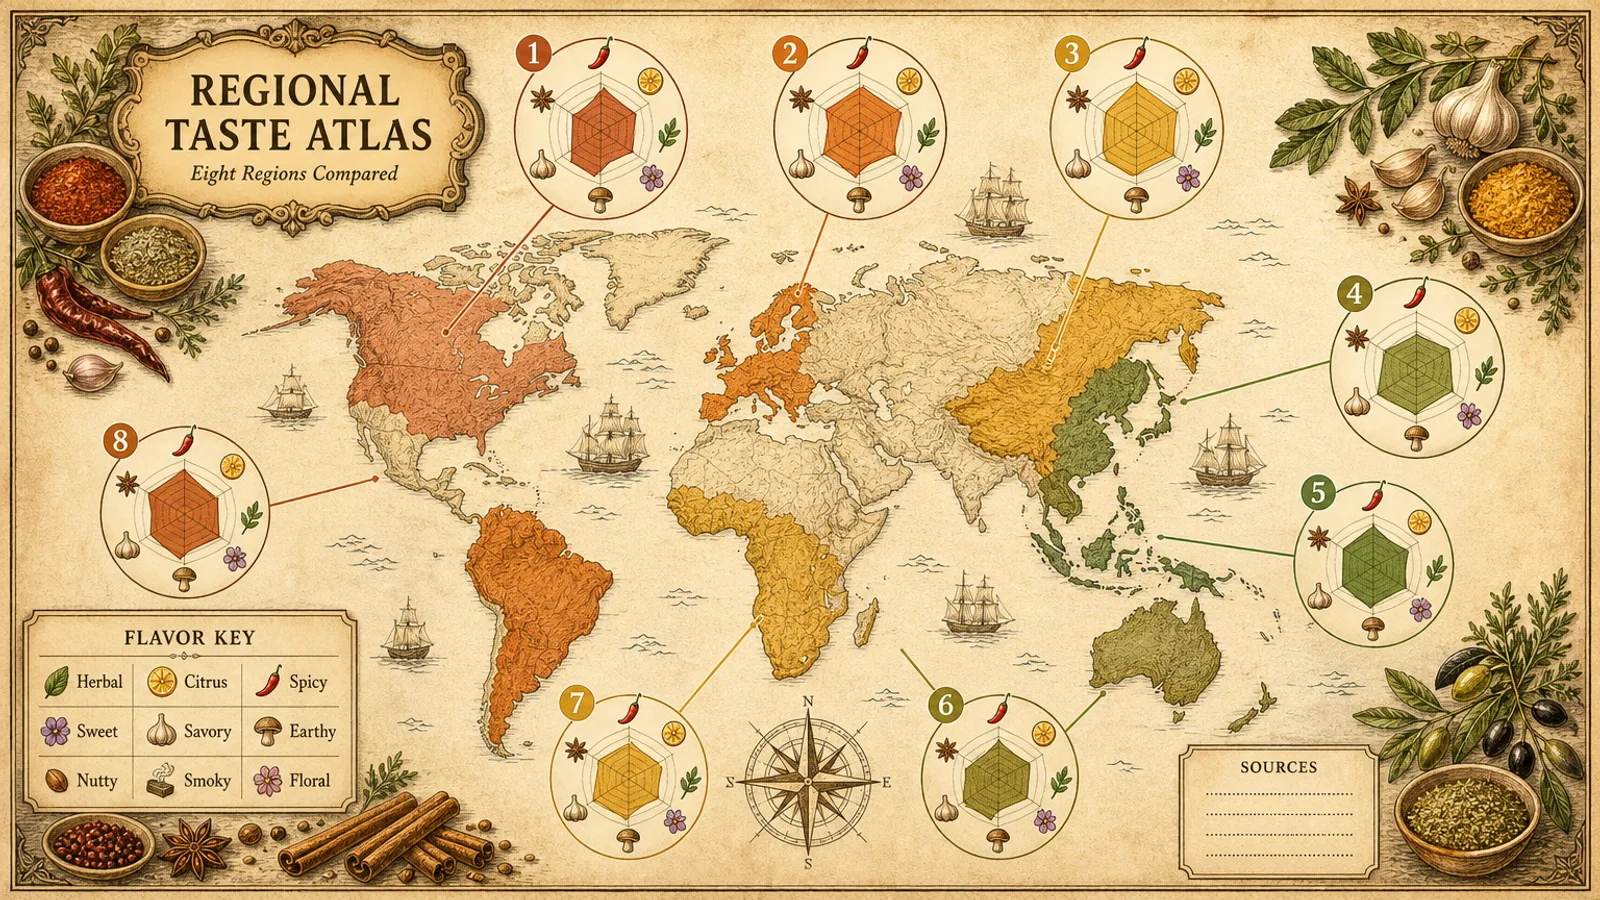
What you get
- Three 16:9 hand-drawn infographics (1536×864) built on one checked teaching point
- The one layout your evidence calls for: comparison, timeline, process, cards or data story
- Blank header, note and citation zones, filled with your exact wording afterwards
Good fit
- Workshops and classes that close on a one-page visual summary
- Research write-ups that rest on a few verified findings
- Blog posts and articles that suit a warm, sketched evidence graphic
Not for
- Filling the layout with numbers or causes nobody has sourced
- Imitating a named illustrator, platform or branded visual system
- Paragraphs of text lettered by the image model itself
About this Skill
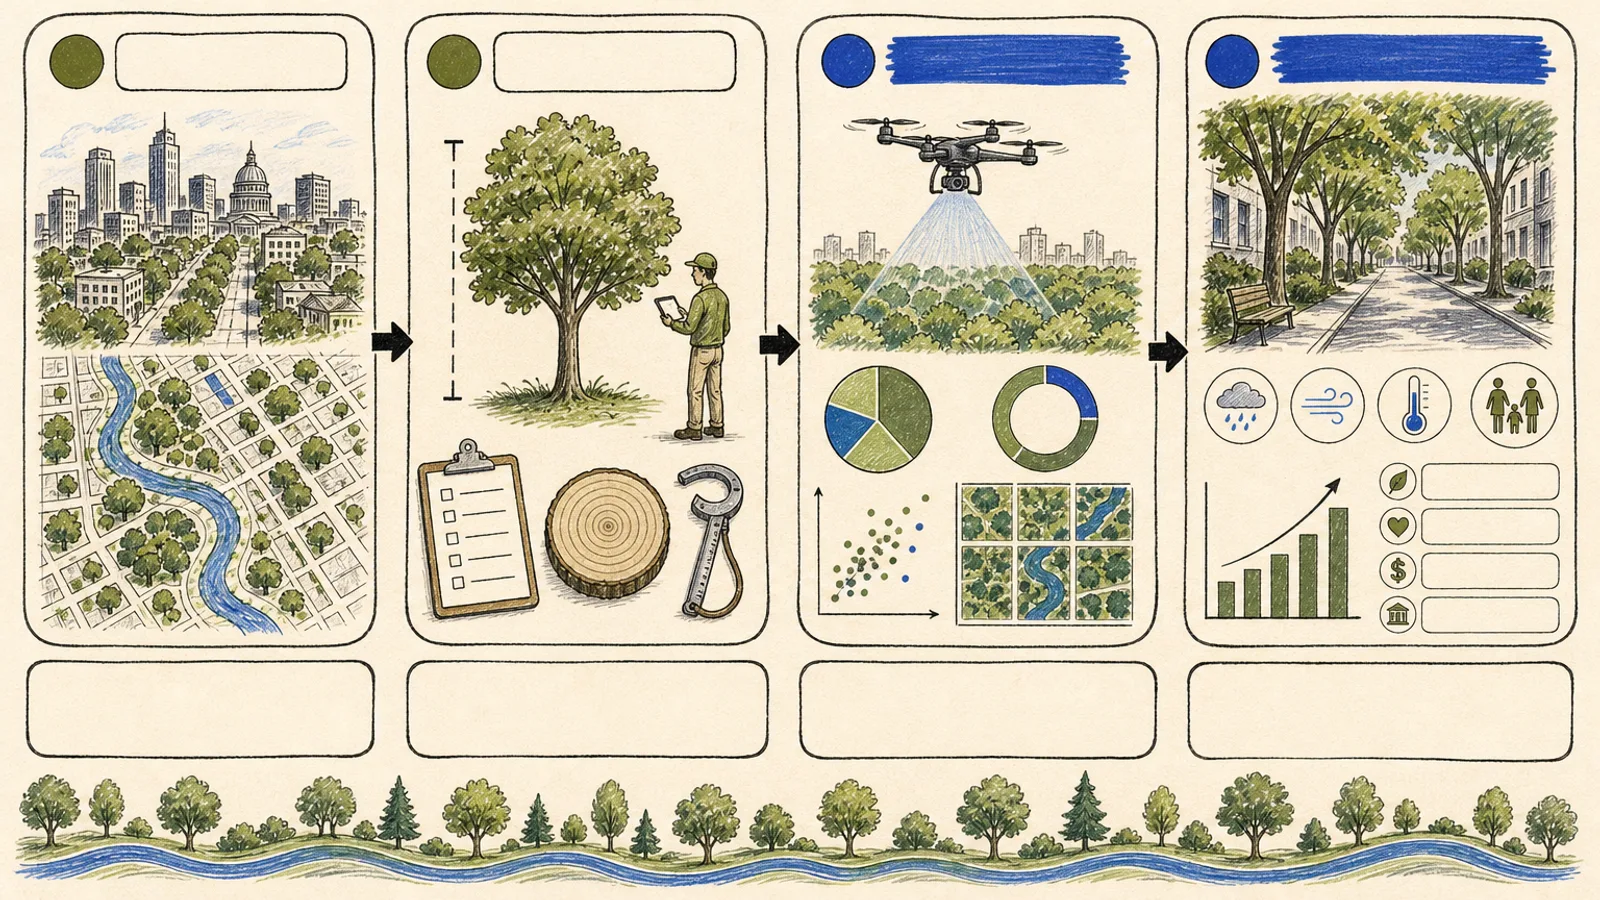
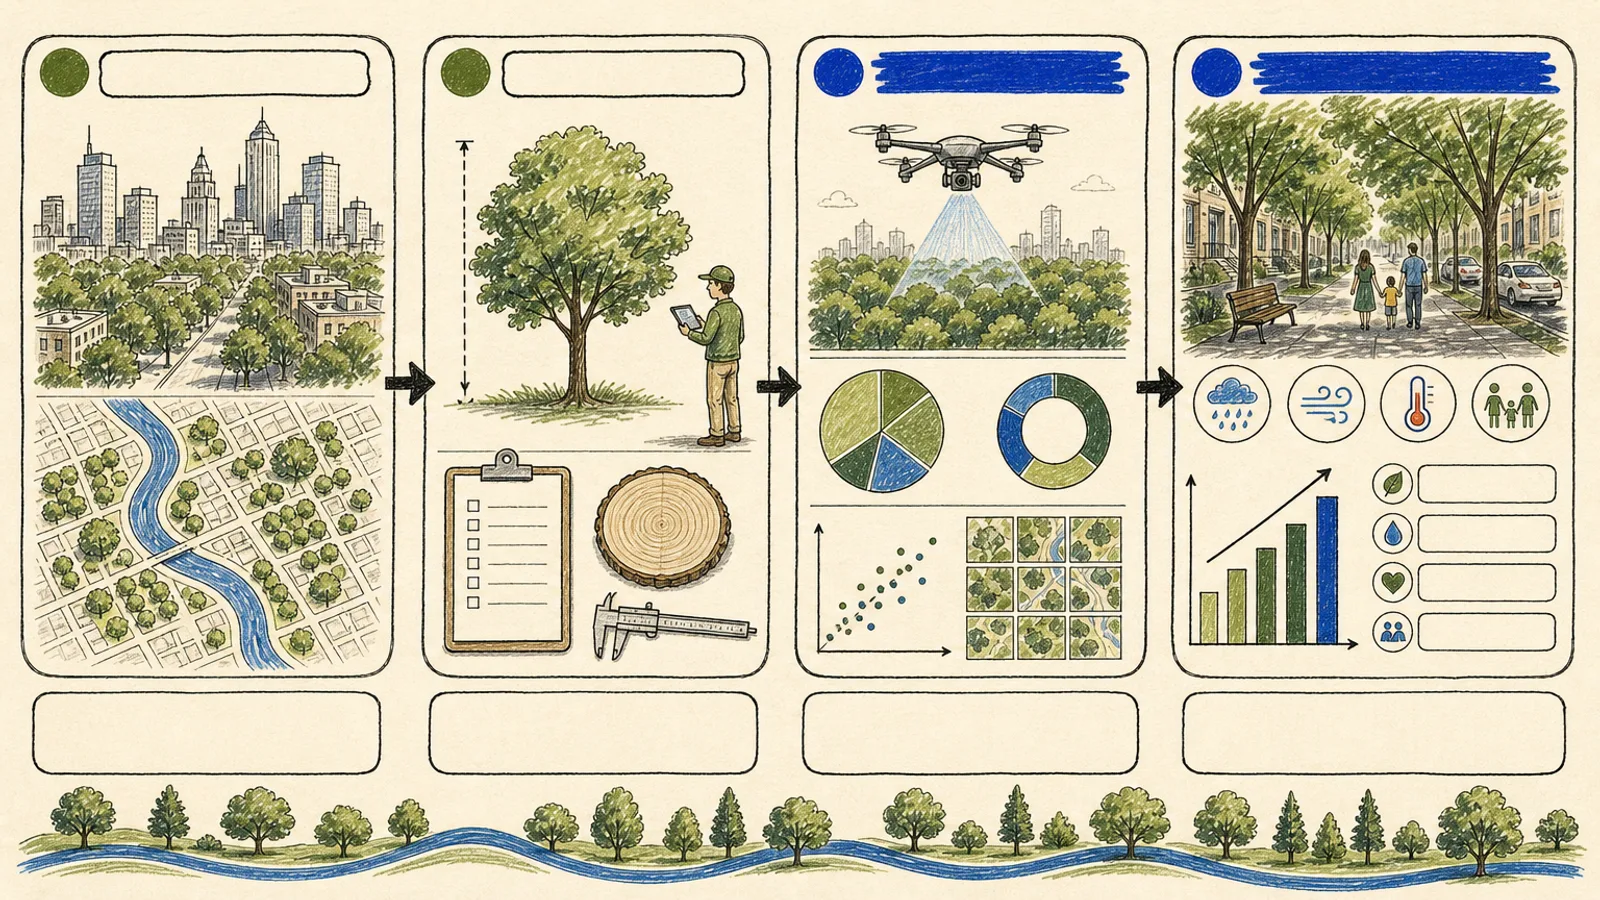
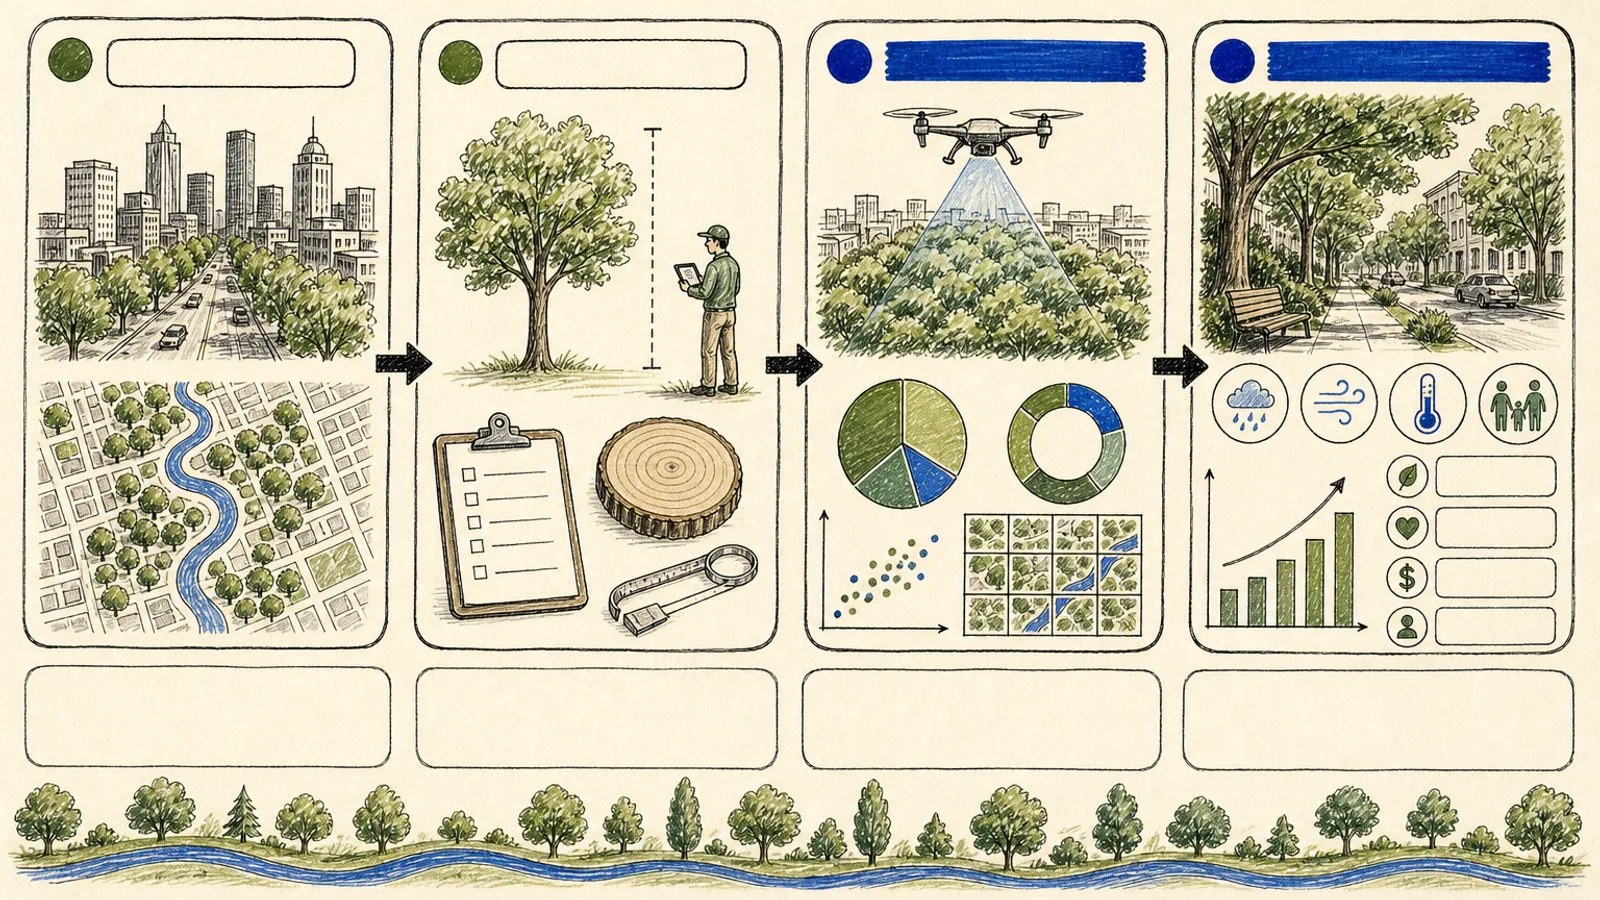
Hand this Skill a short set of checked facts and the people they are for, and it narrows them to one teaching point backed by three to six findings. It then picks the single structure the evidence needs (comparison, timeline, process, card set or data story) and draws it like a sketchbook page: black ink outlines, marker and colored-pencil strokes, a few muted accents and plenty of open cream space. The sample traces how a city's tree canopy is studied in four panels joined by arrows. One paid request returns three 1536×864 variants.
How it works
- Reduce the material to a single teaching point and the three to six facts that support it.
- Choose one layout pattern to match the evidence: a comparison, timeline, process, card set or data story.
- Plan the reading path with loose marker lines, a handful of quiet accent colors and generous blank space.
- Leave zones open for the wording and place your verified labels once the art exists; the model letters no small text.
- Review hierarchy, factual links, reading order, citations and accessibility before handover.
Checked before delivery
- The three images differ from one another, are sharp and are exactly 16:9
- Every visible fact and relationship matches the approved inputs
- Exact labels and citations are set after generation, never drawn by the image model
- No logos, watermarks, borrowed identities, wrong anatomy, duplicated panels or unreadable hierarchy
What you need before you start
- You bring
- The checked topic, its facts, and your source notes · Who will see it and what they should learn · The structure you prefer: comparison, timeline, process, or data story · The exact labels and claims to set in once the image exists
- Dependencies
- Your FAL account, with FAL_KEY set · Node.js 20 or later
- Outside costs
- FAL_KEY
- Last tested
- v1.0.0 — Claude Code / Codex / Cursor
User reviews
Loading reviews…
FAQ
Can it carry real numbers?
Yes, if they are checked. Values and labels go into the empty zones once the image exists, not into the generated art.
Which structures are available?
One per graphic: comparison, timeline, process, card set or data story, chosen to fit the evidence.
Does it reuse the sample pictures?
No. Each run composes something new from the visible traits of the style and the content you approved.