Stacked Column Panelv1.0.3
Use this Skill to make an infographic.
- Yours to keep: the files stay on your computer.
- Payment by Waffo Pancake, our merchant of record.
- 38 free Skills to try first
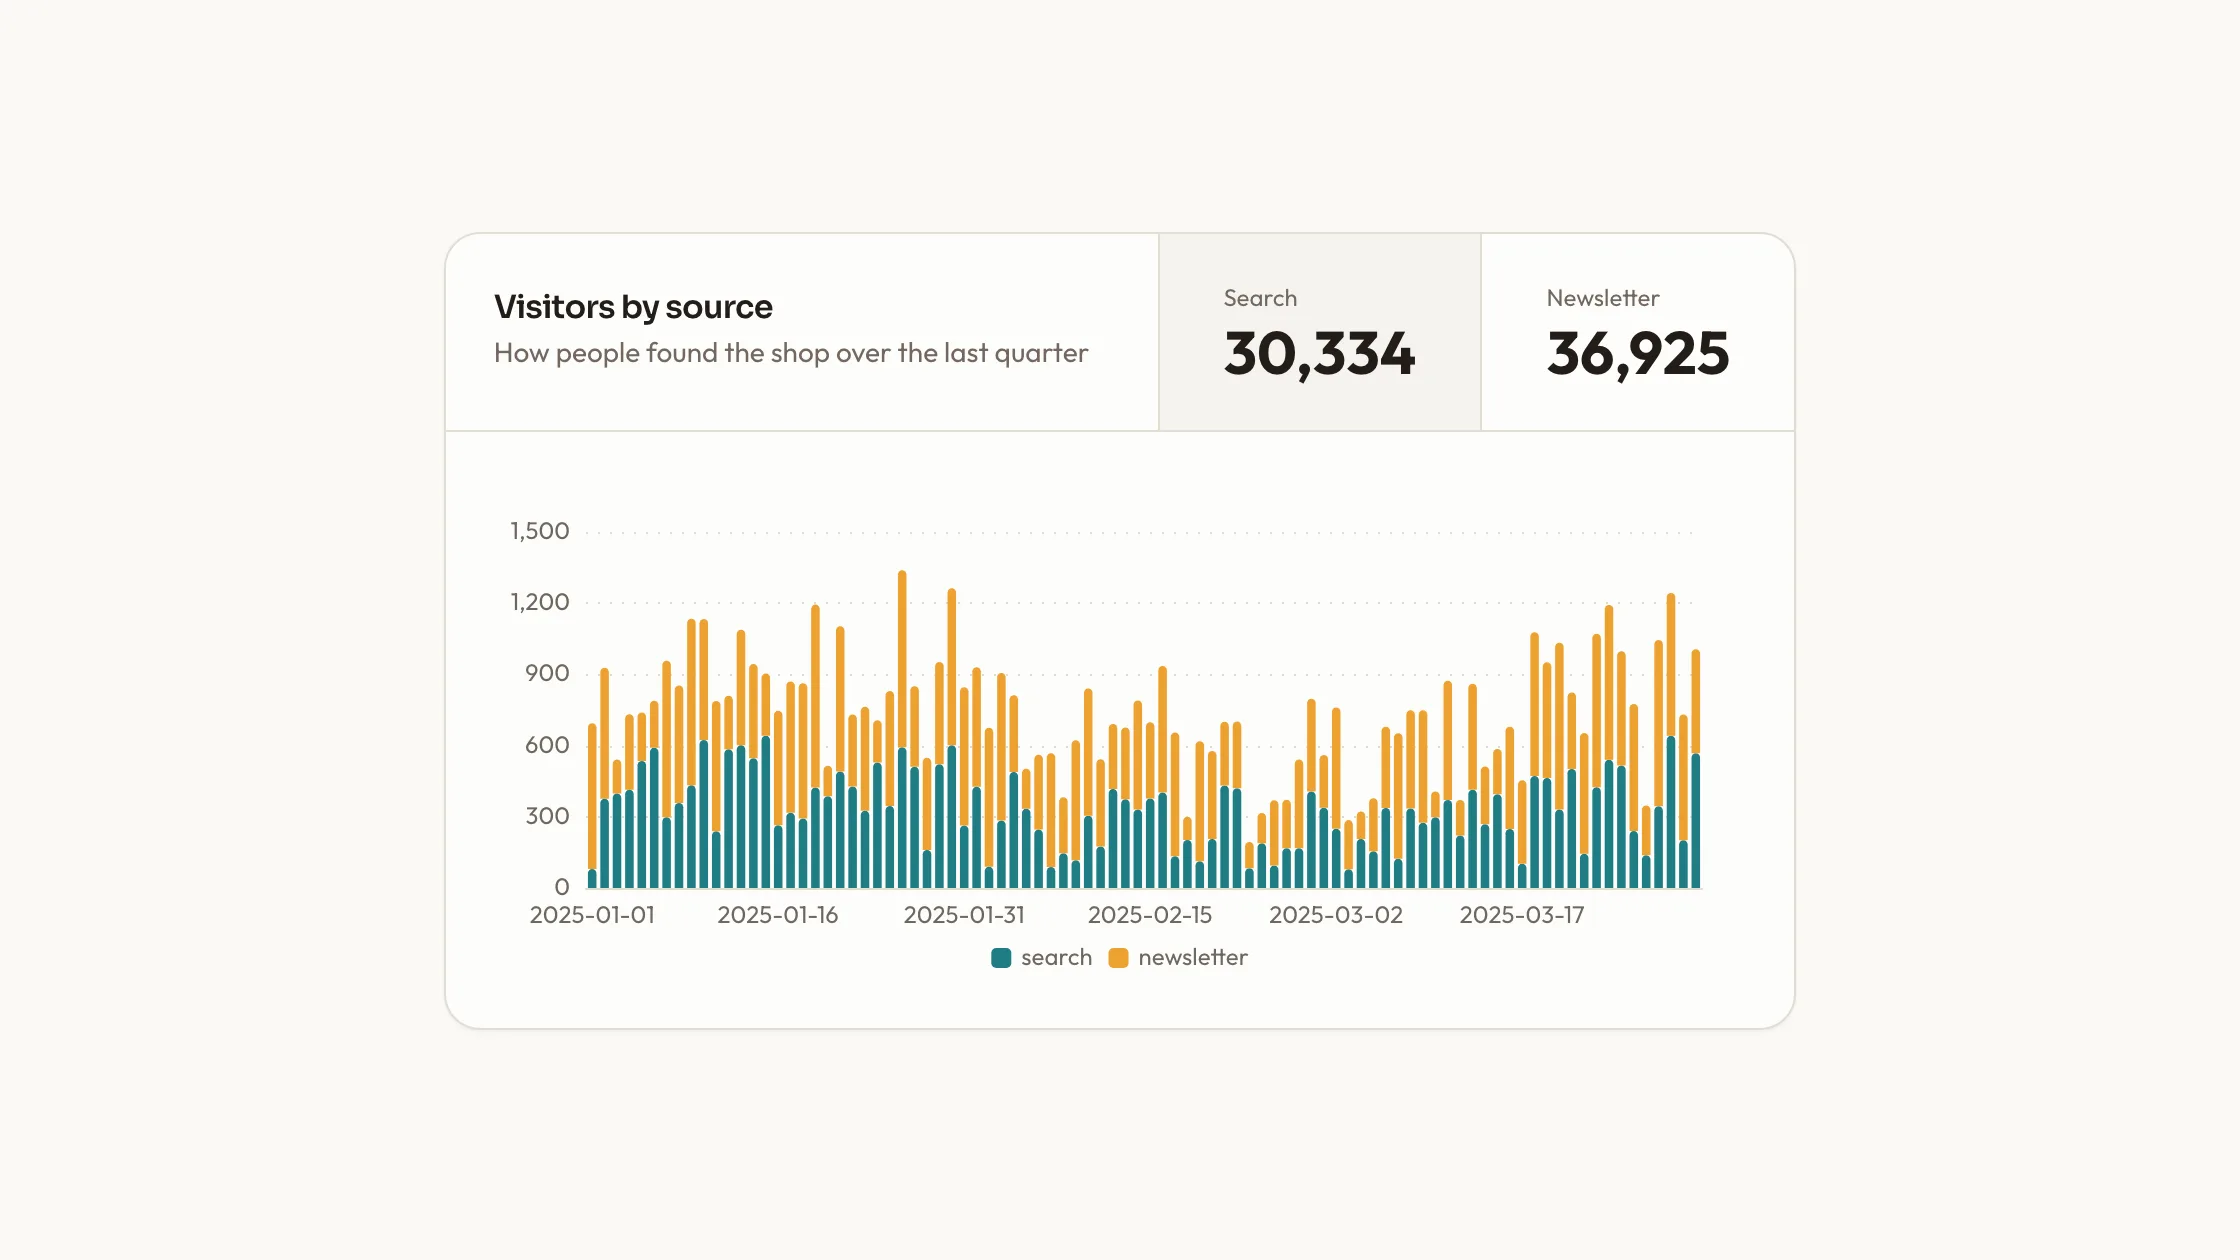
A stacked bar chart skill for Claude Fable 5: each day is one column split by source, under a total tile per source, as React source with ECharts and Recharts.
Picked most often by
Updated Nov 9, 2026
Preview gallery


Similar Skills
View all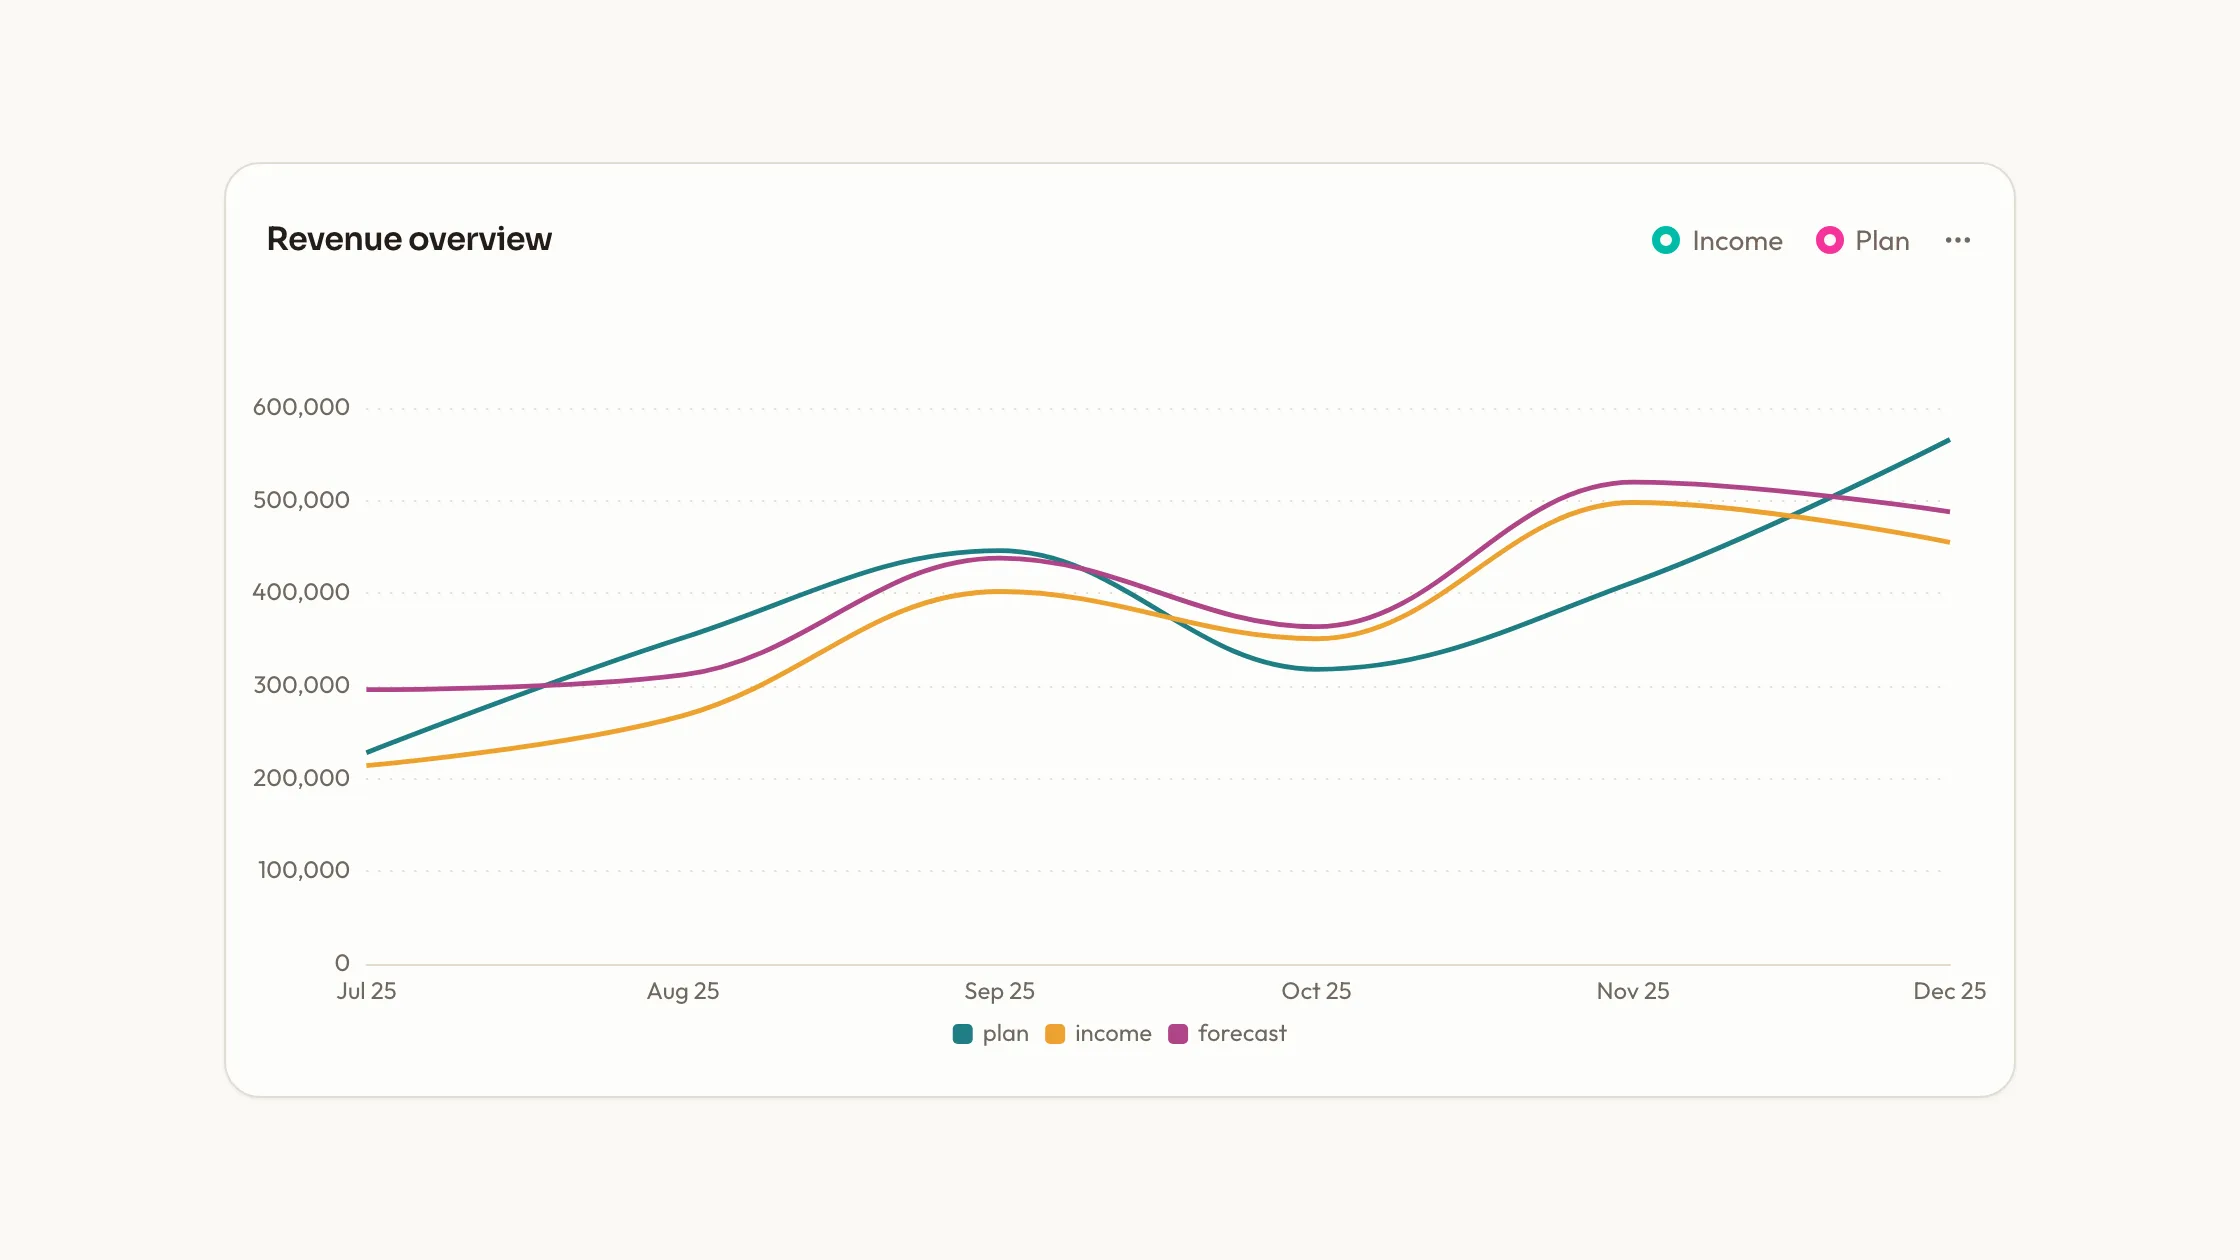



What you get
- Stacked Column Panel as editable source: the card with its total tiles, a ready ECharts panel and a usage example of a shop's visitors.
- Palette, type, radius, icon and motion tokens in references/theme.md, kept together in one file for easy edits.
- Series held as plain arrays in the chart's data, so replacing the sample with your numbers is direct.
Good fit
- Reports showing how a daily total breaks down across channels or sources.
- Pages where each source's total should sit right above the daily detail.
- Projects that want stacked columns from a real charting library in the page's own colors.
Not for
- Products that already follow a design system of their own; this block's palette and type scale would compete with it.
- Anyone wanting a versioned package from npm; you receive source code and keep it up to date yourself.
- Streaming dashboards, or charts that must handle very large data sets.
About this Skill
Stacked Column Panel is a stacked column chart skill for Claude Fable 5, made for showing how one daily total divides between sources. The usage example is a card of a shop's visitors over a quarter: a title and description sit beside two tiles, each with that source's sum, and clicking one marks it. Below, ninety days of columns stack search and newsletter on a shared axis, with a tooltip for the day under the cursor. The package also carries the same chart as a single ECharts panel with a legend, teal under amber. Swap in your own series and the chart redraws in the block's tokens.
How it works
- Say which page gets the chart; the agent reads package.json and your framework config, then writes it in the project's idiom.
- Rename the title, description and sources; the tokens hold sizes and spacing steady.
- Hand over your daily figures; every series sharing the stack joins the same column.
- Run scripts/check-blocks.mjs, then view the chart at phone width before it goes live.
Checked before delivery
- Every part is drawn through ECharts as one layer of the same stacked column, in the set's series colours and order
- Each tile's total is the sum of its part, and the tooltip lists every part at the category under the cursor
- scripts/check-blocks.mjs reports no symbol icons, no off-palette blue or violet and no remote files
What you need before you start
- You bring
- A title, a short description and the parts to stack, each with a name for its tile · One row per category, such as each day of a quarter, with a number for every part
- Dependencies
- ECharts 5+ for the panel; Recharts for the usage example's card
- Outside costs
- None
- Last tested
- v1.0.3 — Claude Code / Cursor
User reviews
Loading reviews…
FAQ
Is it only for React?
The source is React, but the agent reads your repository first and rebuilds the chart in your framework, keeping a real charting library for the columns. You get a standalone HTML file only when you ask for one.
Does the chart pull anything from the web?
No. Fonts, icons and pictures are local files, the sample numbers are computed in the file, and scripts/check-blocks.mjs flags anything loaded from another host.
How do I add another source to a column?
Add a series that names the same stack. In Recharts that is one more Bar with the same stackId, plus one more key in the tile list.