Summary Trend Linesv1.0.1
Use this Skill to make an infographic.
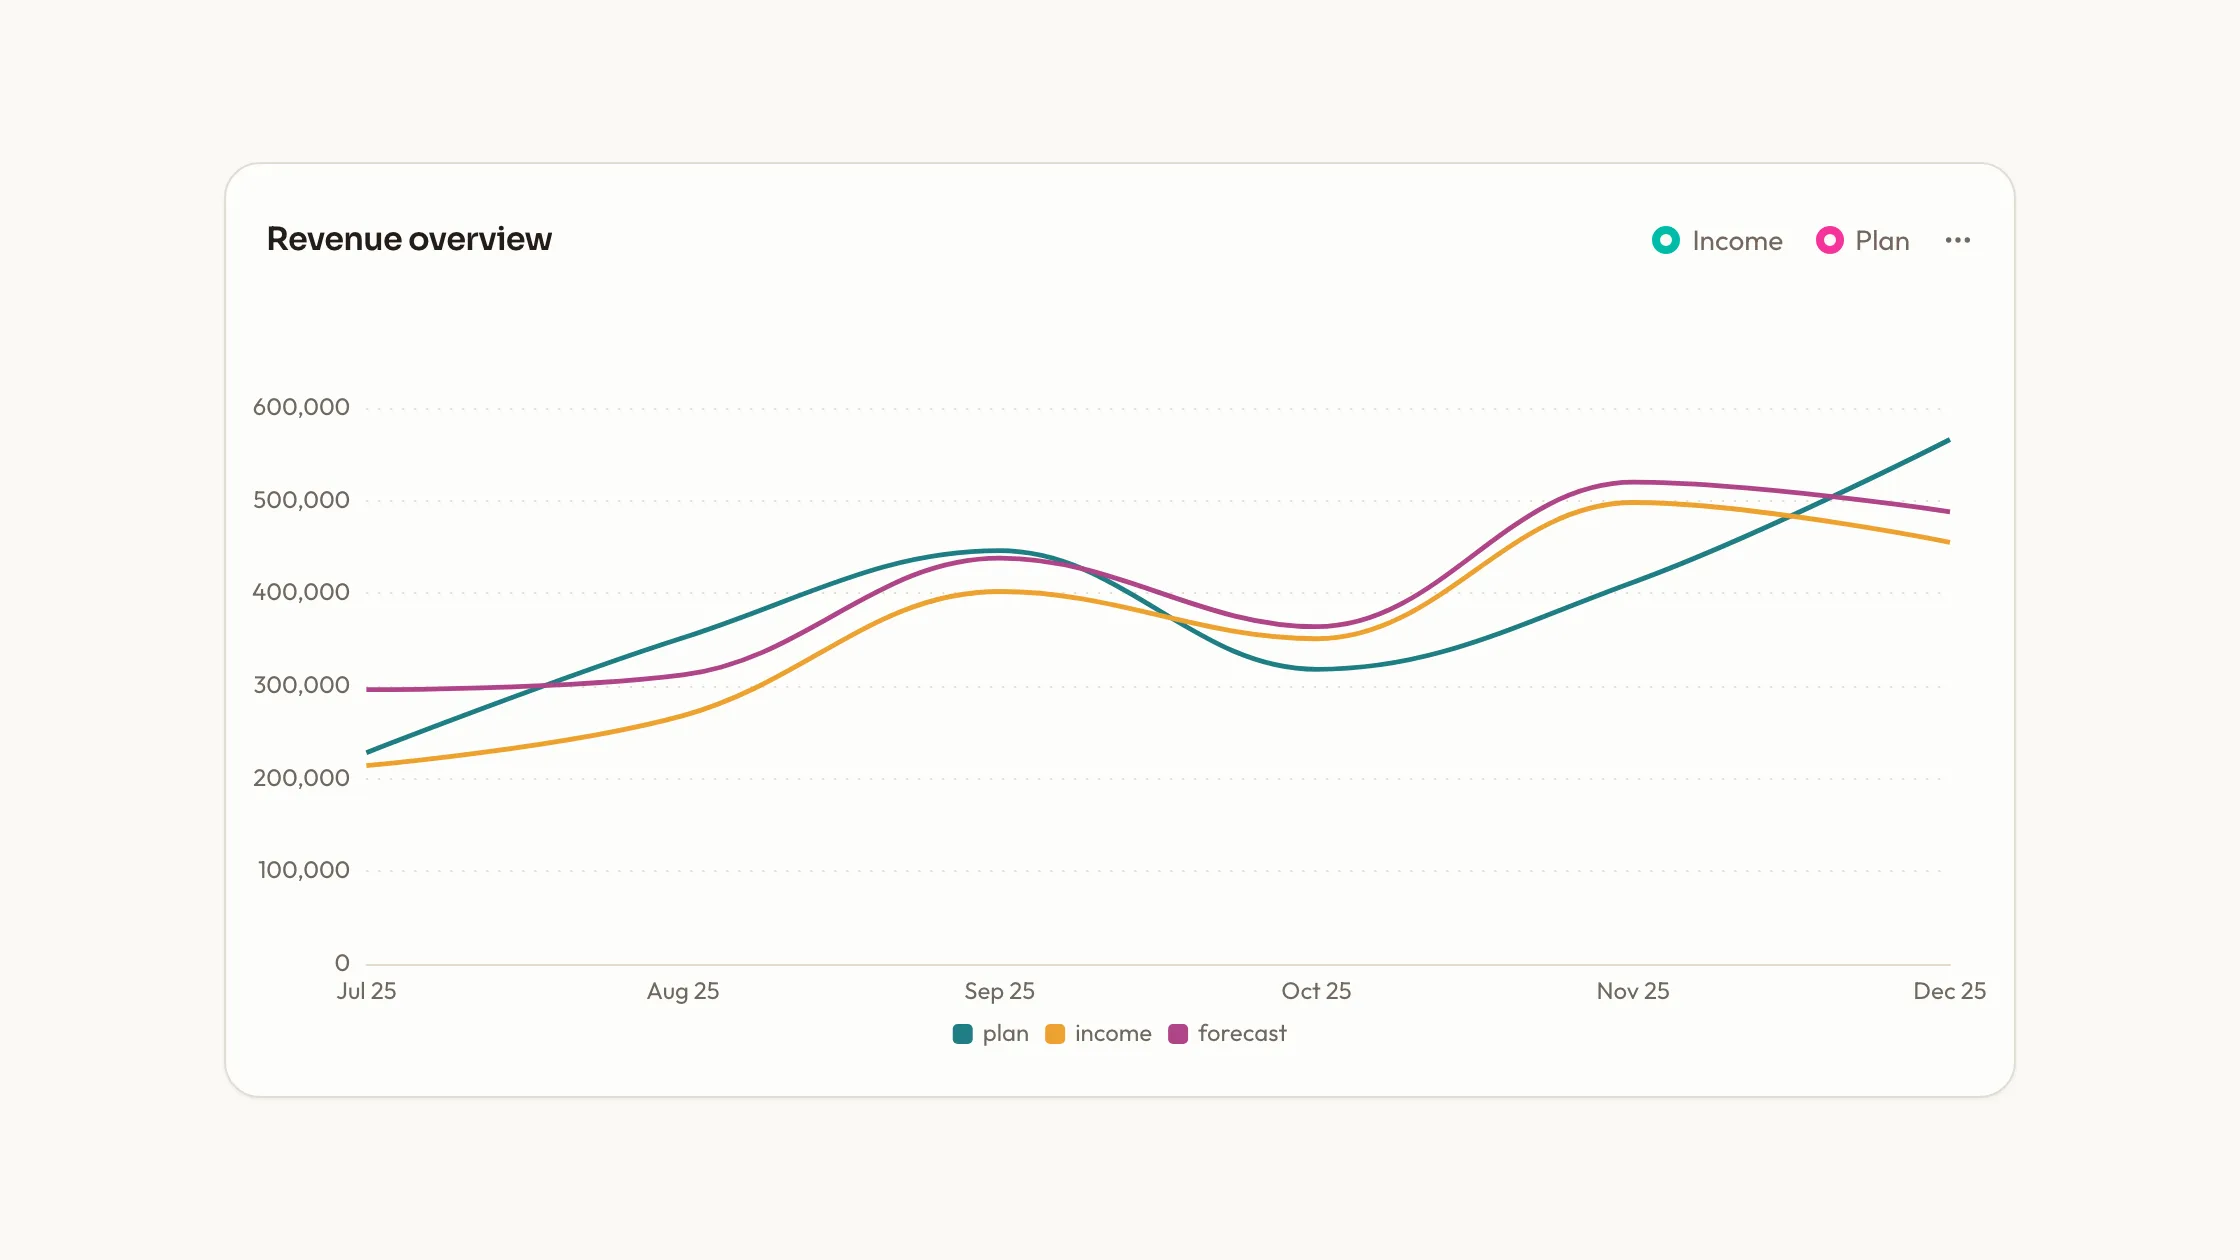
A line chart skill for Claude Fable 5: a titled card of smooth lines setting a result against its targets month by month, as React source drawn by ECharts.
Picked most often by
Updated Nov 6, 2026
Preview gallery


Similar Skills
View all
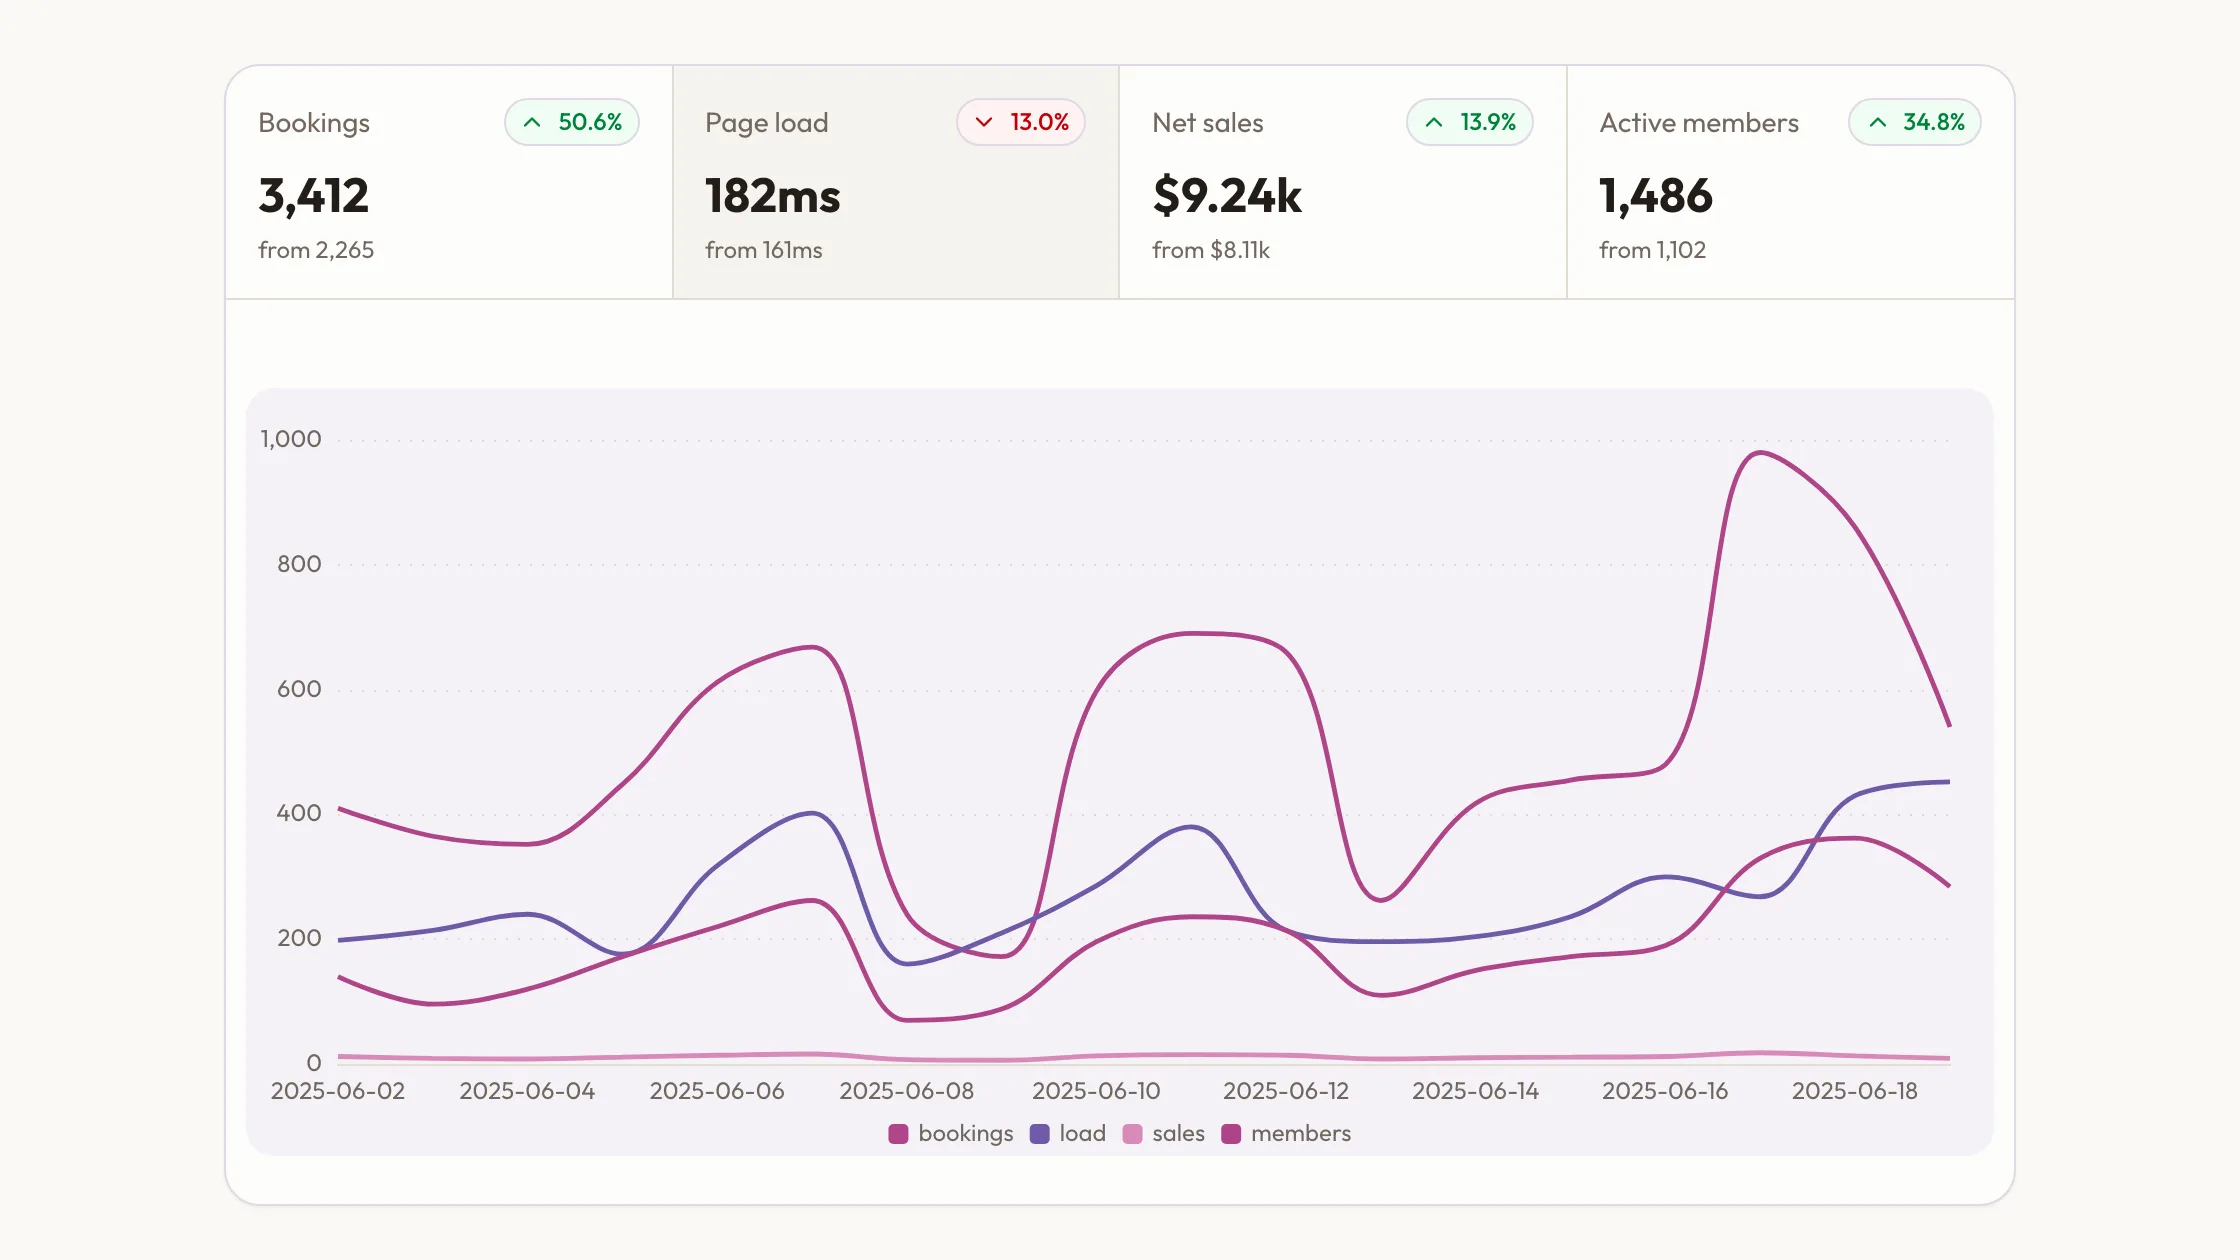
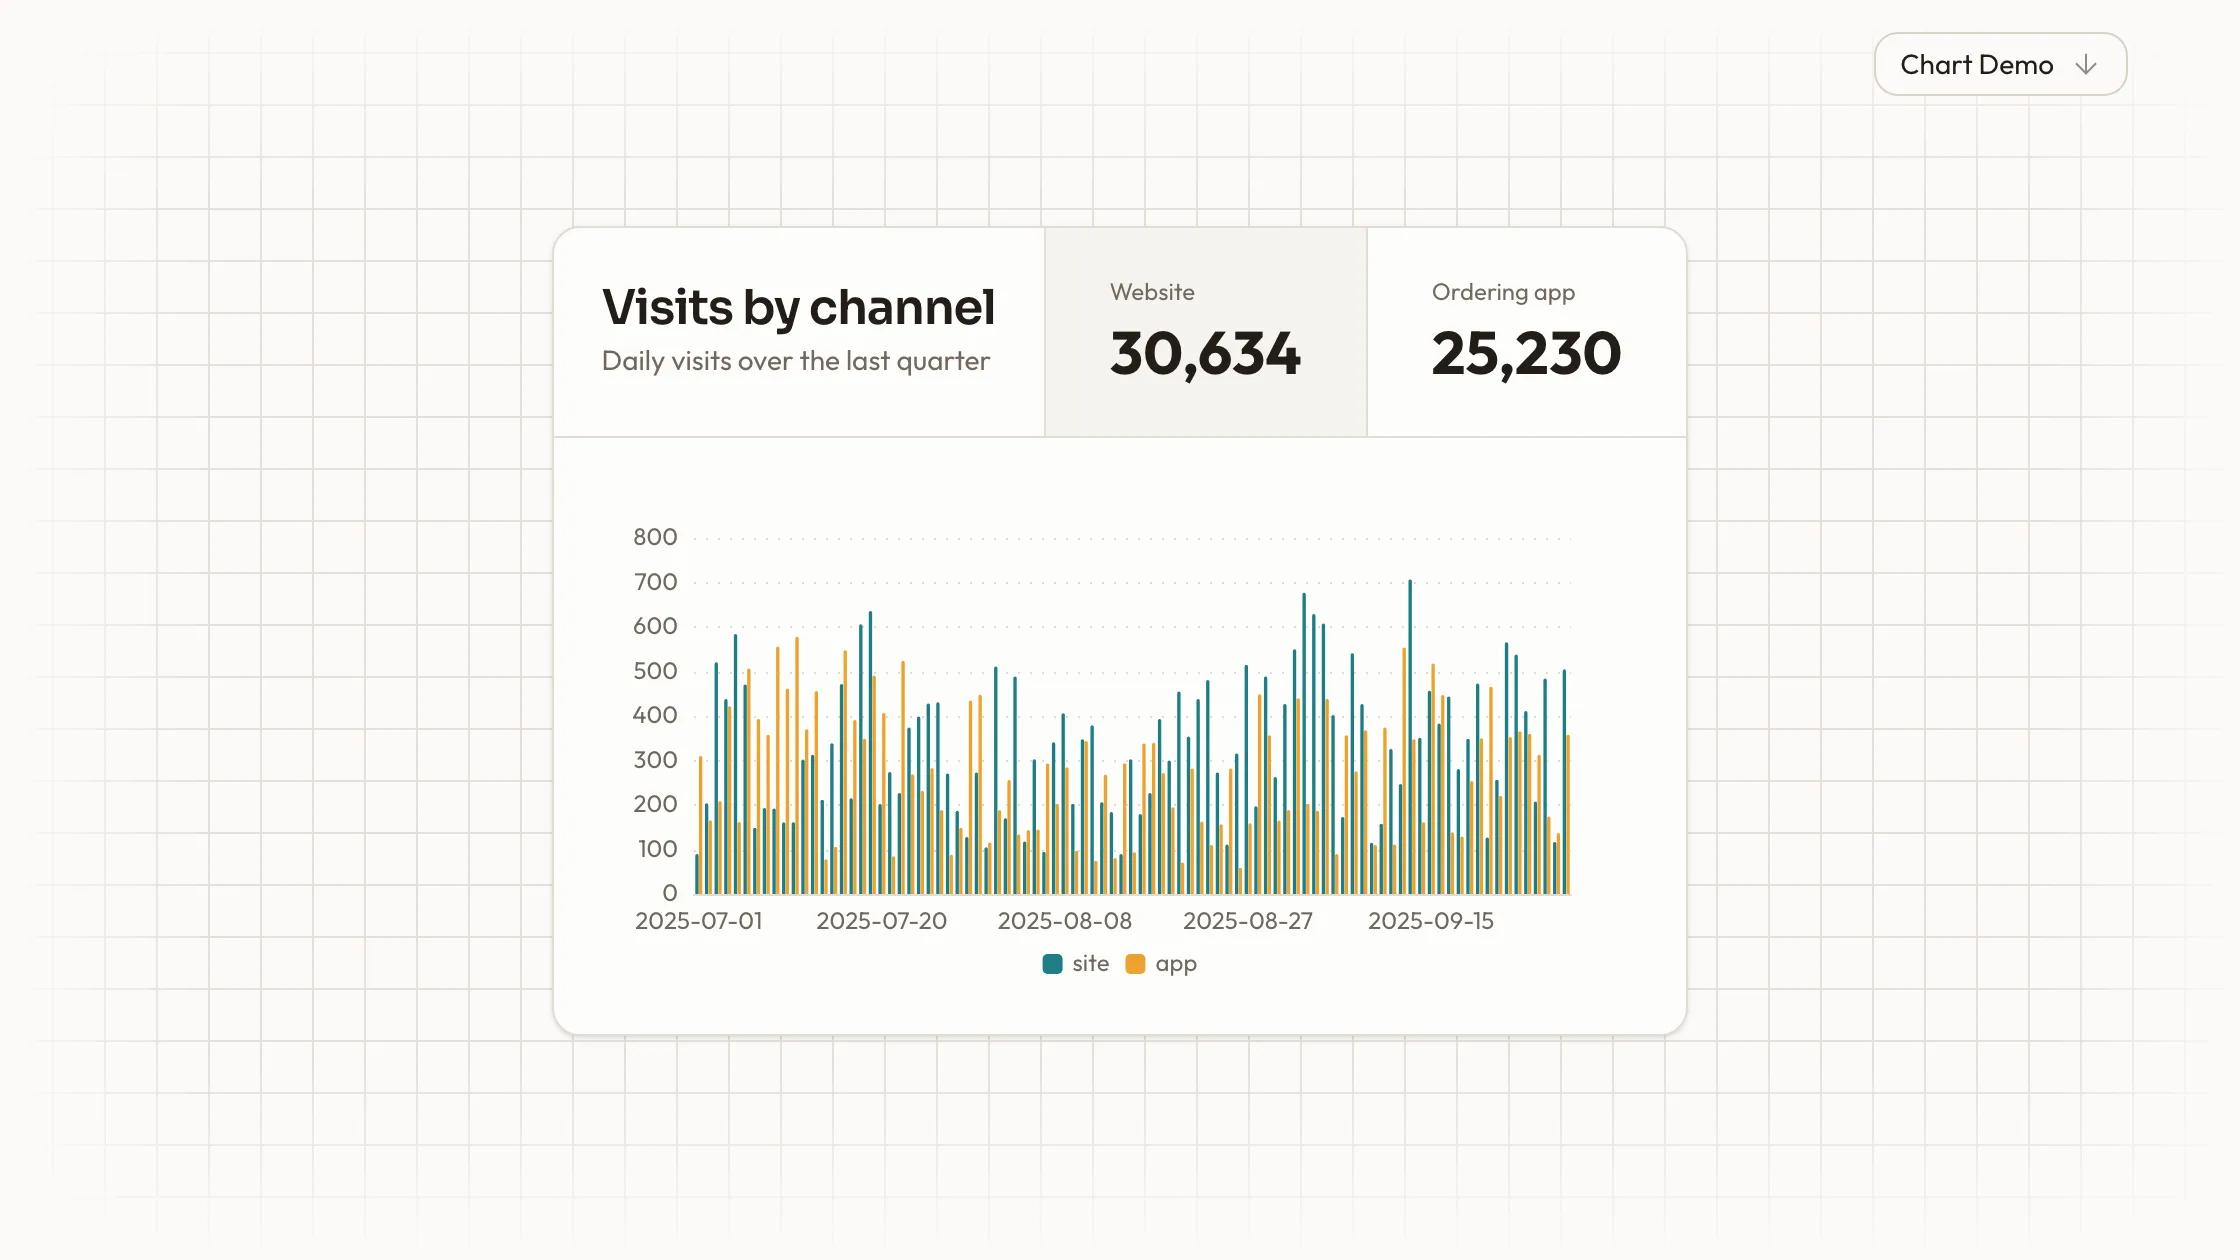
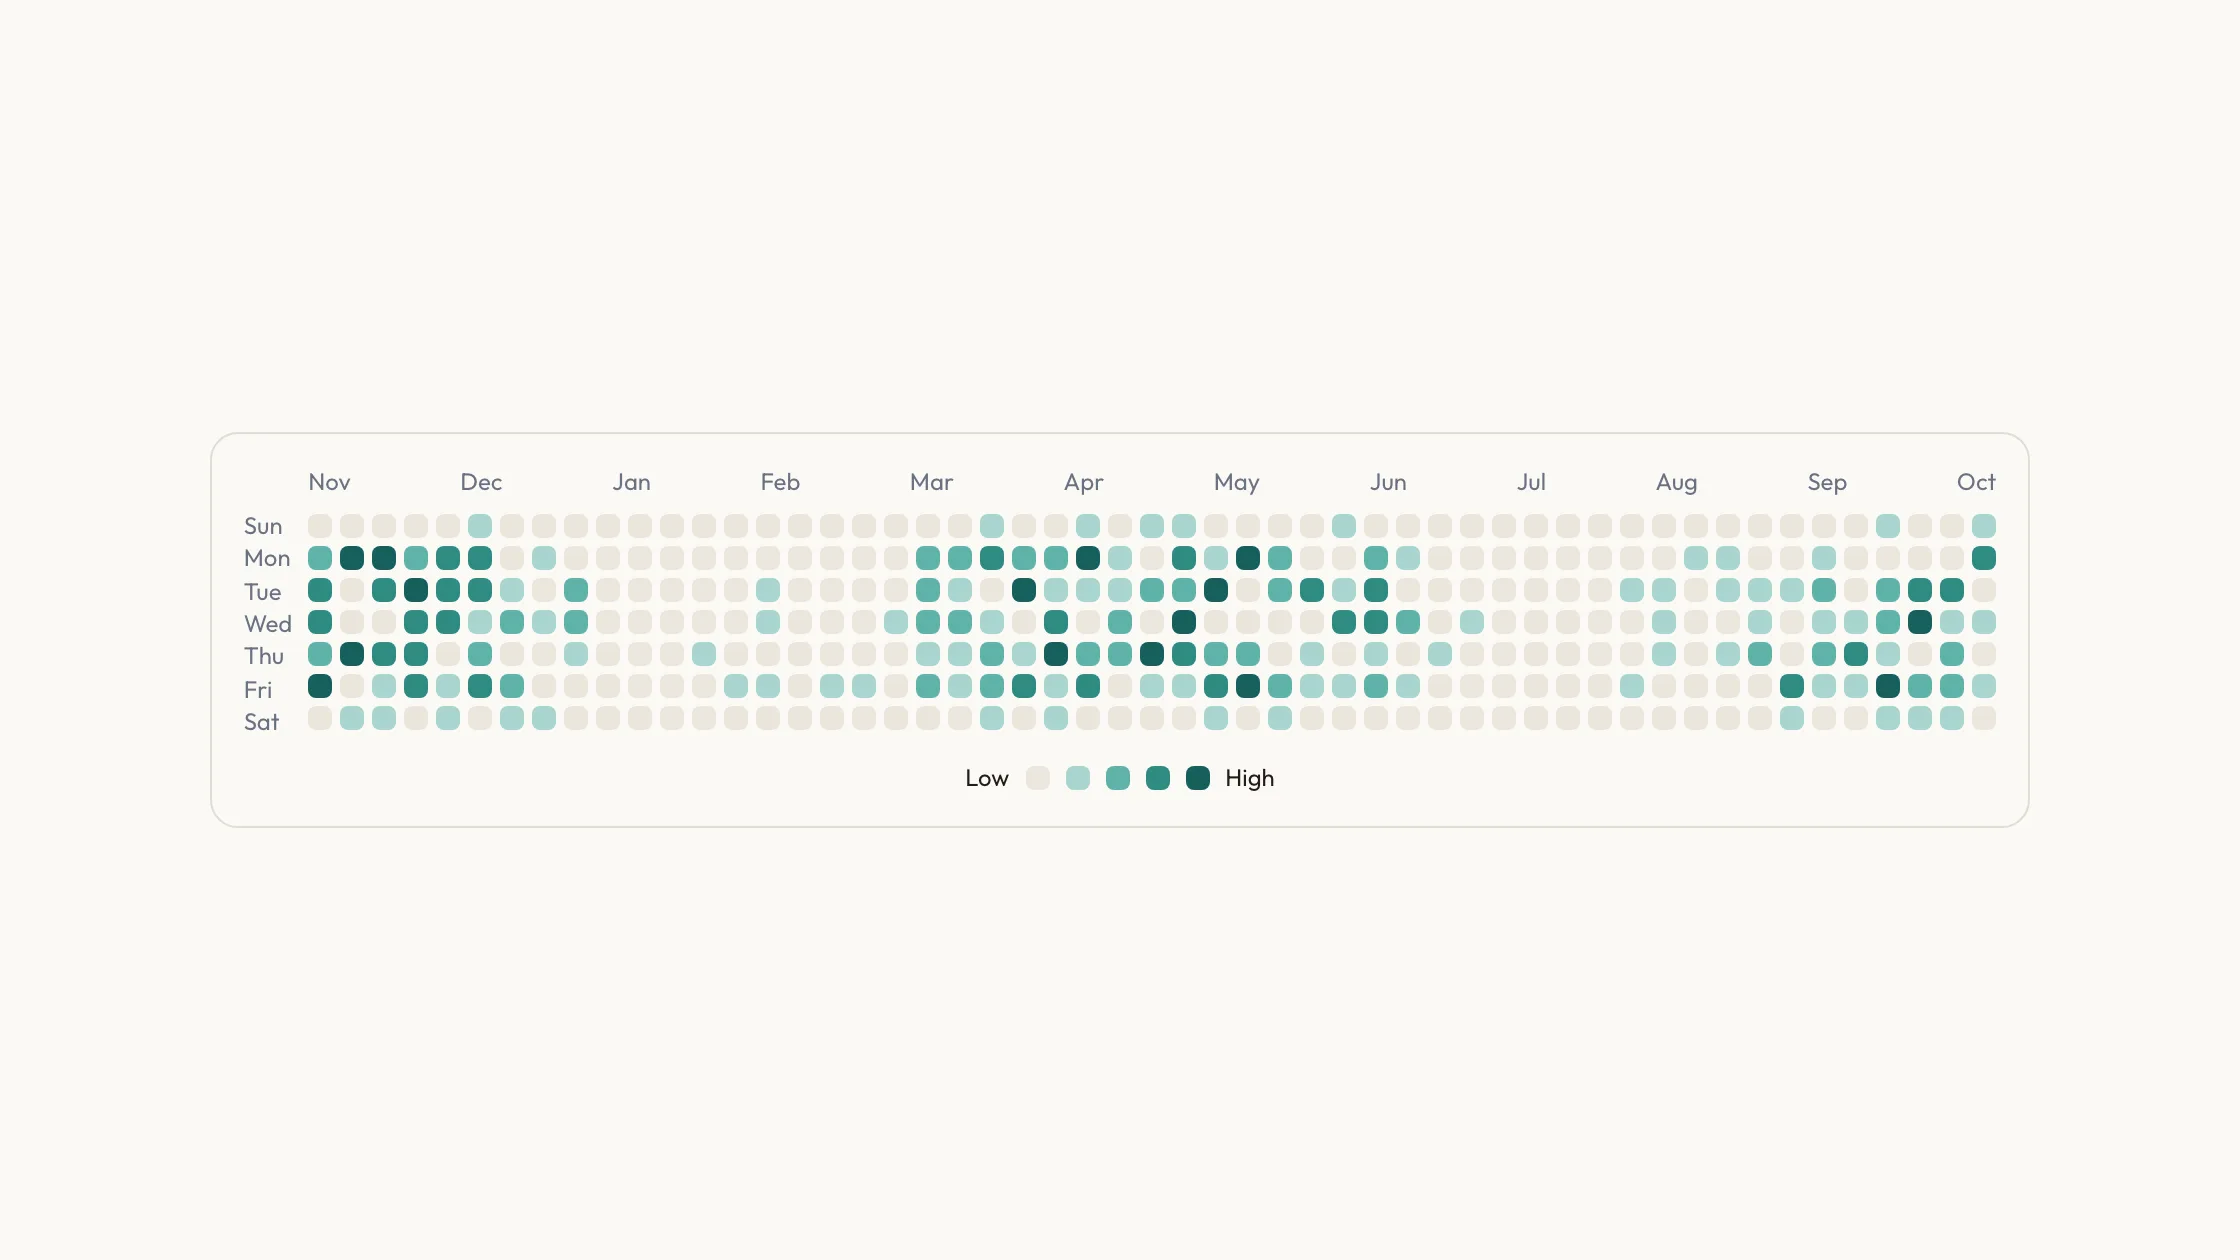
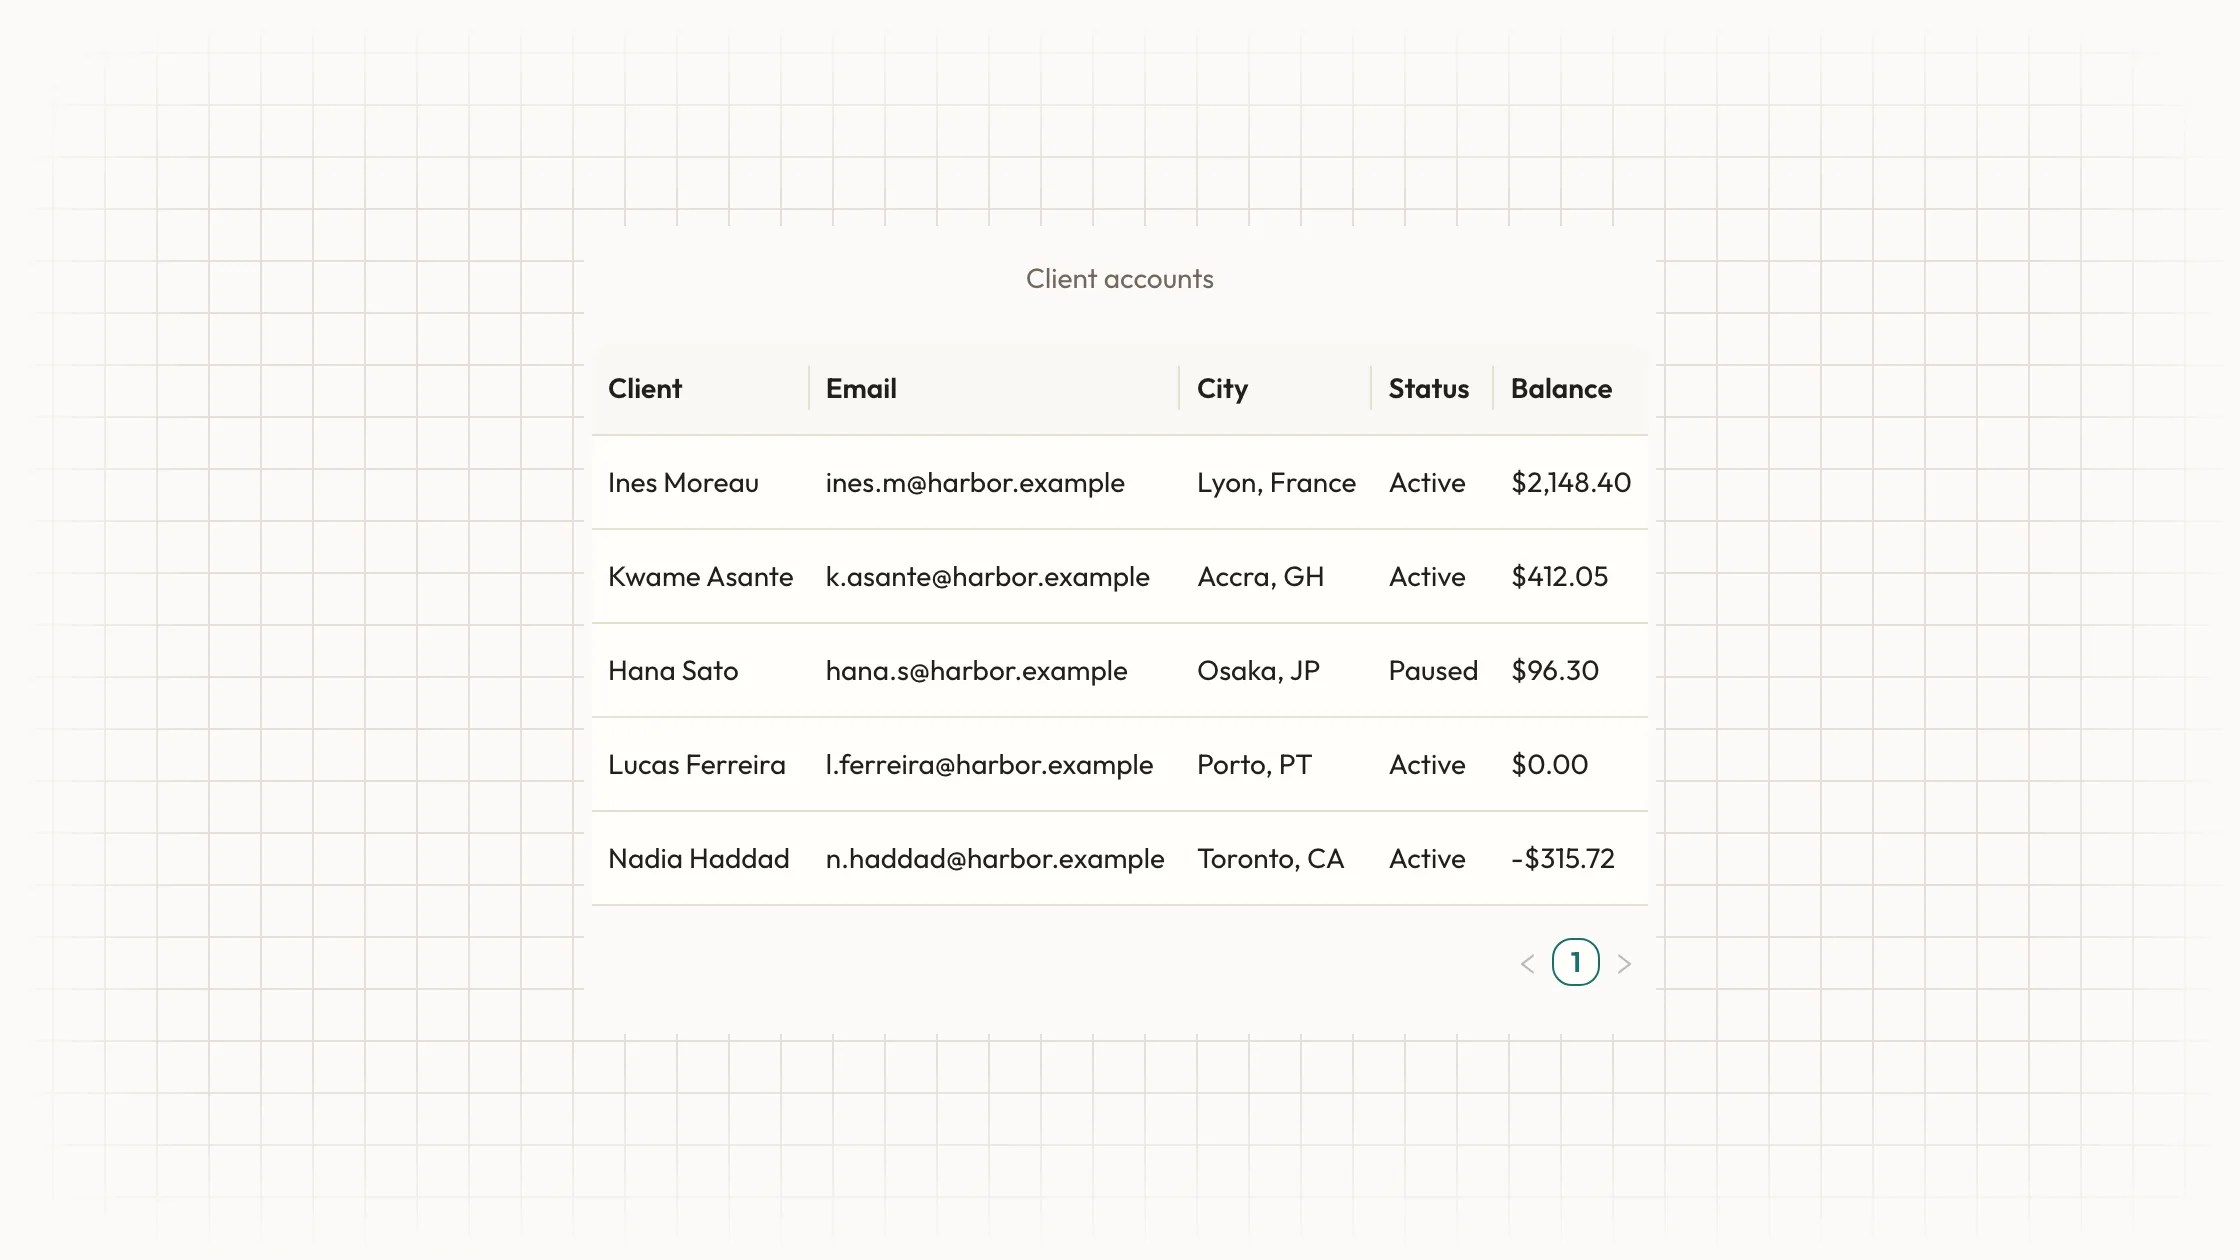
What you get
- Summary Trend Lines as editable source: the card with its header and menu, the ECharts panel and a usage example of a design studio's six months of revenue.
- Palette, type, radius, icon stroke and motion timing as tokens from references/theme.md, kept in one place.
- The chart's ECharts option with labels and series as plain arrays, ready for your own figures.
Good fit
- Revenue, sales or enrollment summaries that set actuals against a plan or forecast.
- Report pages that need one calm card of a few lines rather than a busy dashboard.
- Projects that want smooth lines from a real charting library in their page's colors.
Not for
- Products that already follow a design system of their own; this block's palette and type scale would compete with it.
- Anyone wanting a versioned package from npm; you receive source code and keep it up to date yourself.
- Many series at once, or live streaming values; the card is built for two or three.
About this Skill
Summary Trend Lines is a line chart skill for Claude Fable 5 for reading a result against the numbers it was meant to hit, such as income against plan and forecast. The card's header carries a heading, a menu button and a small legend of ringed dots. Below, ECharts draws two or three smooth lines across your period labels, six months in the sample, with a legend and a tooltip that lists every series at the label under the pointer, thousands separators included. Give a series fewer values than the others and the agent names it instead of leaving a gap nobody can explain.
How it works
- Say which page gets the block; the agent studies package.json and the framework config, then writes it in the project's own idiom.
- Swap in your own titles and labels; the theme tokens keep sizes and spacing in place.
- Hand over your real series; ECharts redraws them in the same colors and axes.
- Run scripts/check-blocks.mjs, then view the page at phone width before it goes live.
Checked before delivery
- Every series is drawn as one smooth line through ECharts, in the family's series colours and order
- The axis tooltip lists every series at the label under the cursor, with thousands separators
- scripts/check-blocks.mjs reports no symbol icons, no off-palette blue or violet and no remote files
What you need before you start
- You bring
- A title and the period labels for the x axis, such as six months · Two or three series to compare, one number per label each, plus the short ringed legend for the header
- Dependencies
- ECharts 5 or newer, installed with your project's package manager
- Outside costs
- None
- Last tested
- v1.0.1 — Claude Code / Cursor
User reviews
Loading reviews…
FAQ
How many lines can the card compare?
Two or three series, one number per period label each, plus the short ringed legend in the header. Uneven series are pointed out before drawing. The block is React; in another framework the agent rebuilds it and keeps ECharts for the lines.
Does the block fetch anything online?
No. Fonts, icons and pictures stay as local files, and scripts/check-blocks.mjs flags any src, href or url() pointing at another host.
How do my own numbers get in?
ECharts reads one option object whose labels and values are plain arrays. Replace them and the colors, tooltip and animation stay put.