Regional Taste Atlasv1.0.1
Use this Skill to make explainer graphics.
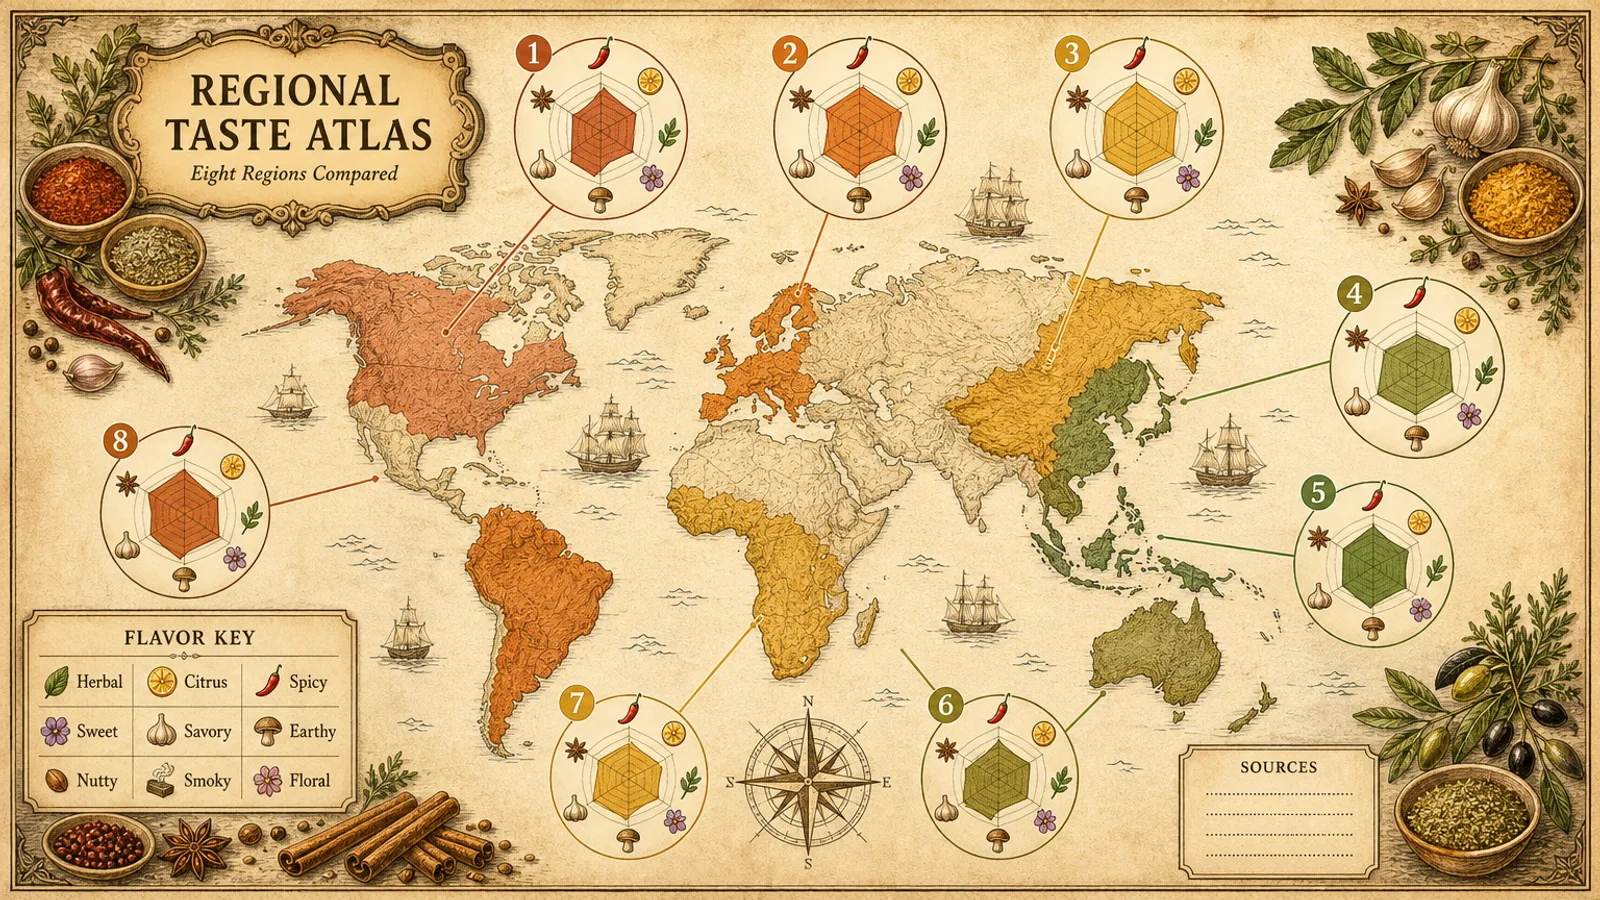
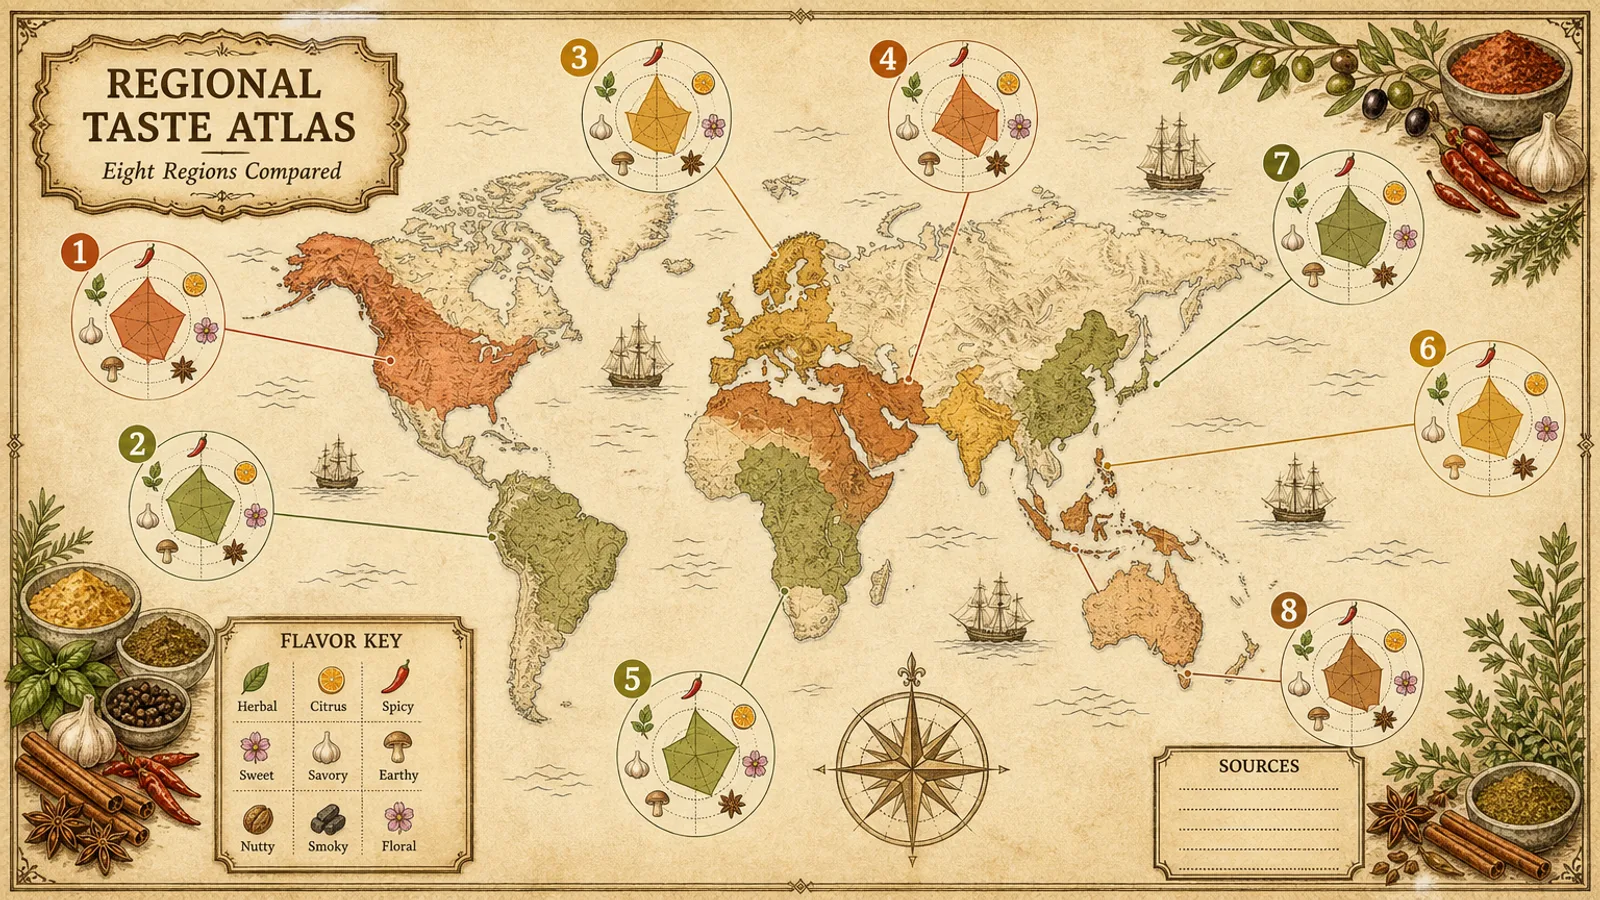
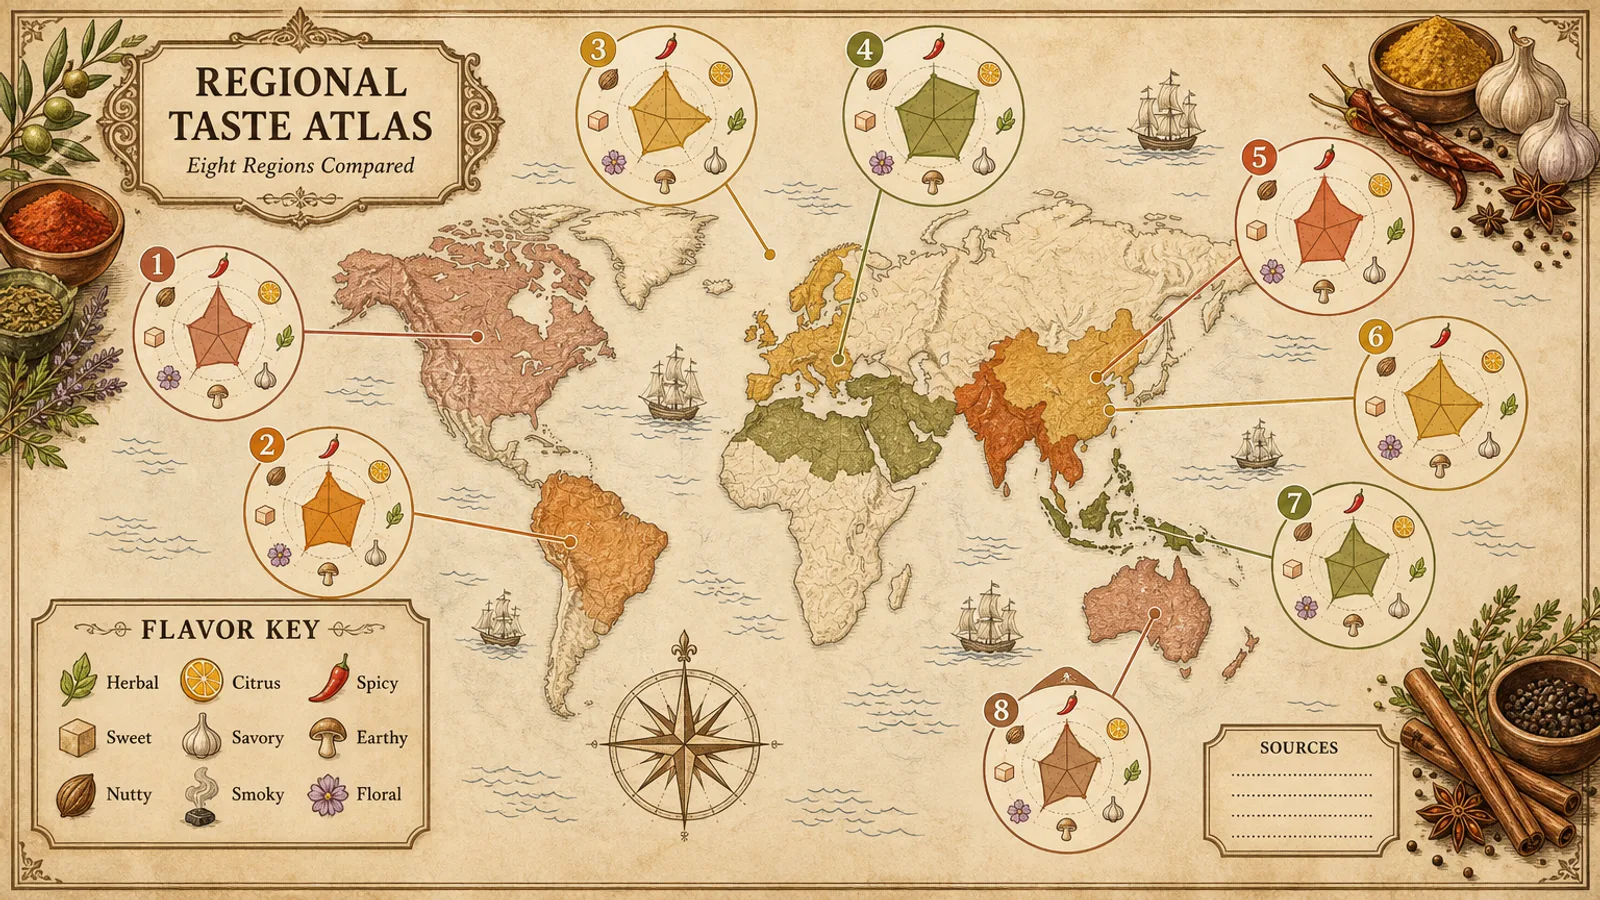
Sourced taste data on a retro parchment map: a Fable 5 skill for analysts and teachers that pairs tinted regions with radar charts on one shared scale, plus legend and source notes.
Picked most often by
Updated Oct 30, 2026
Preview gallery


 FAL
Similar Skills
View all
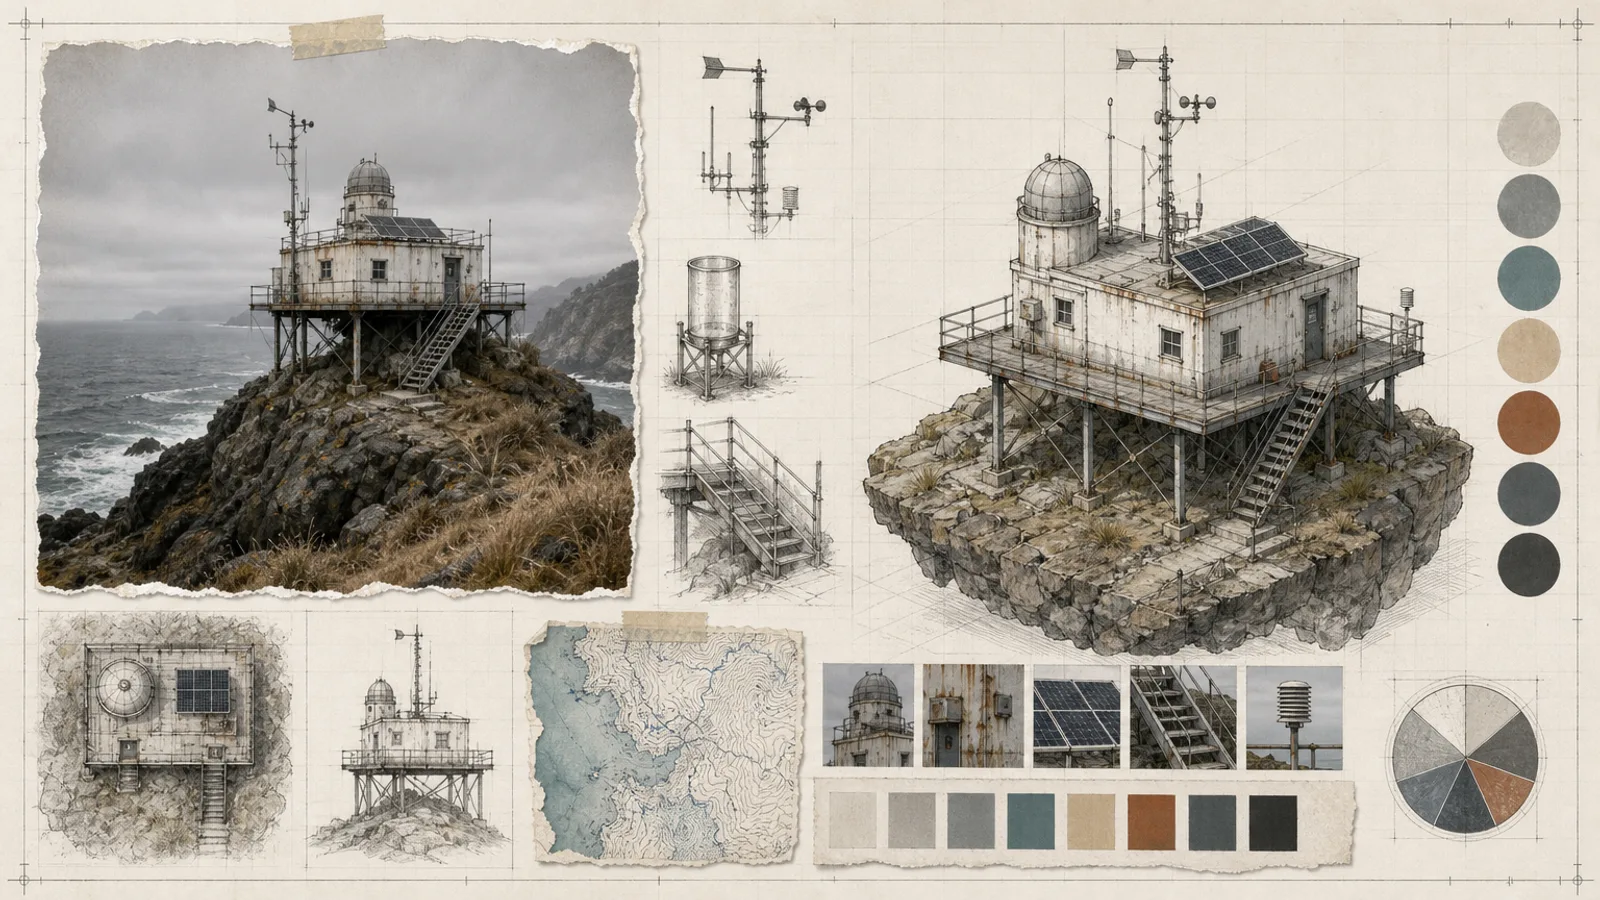
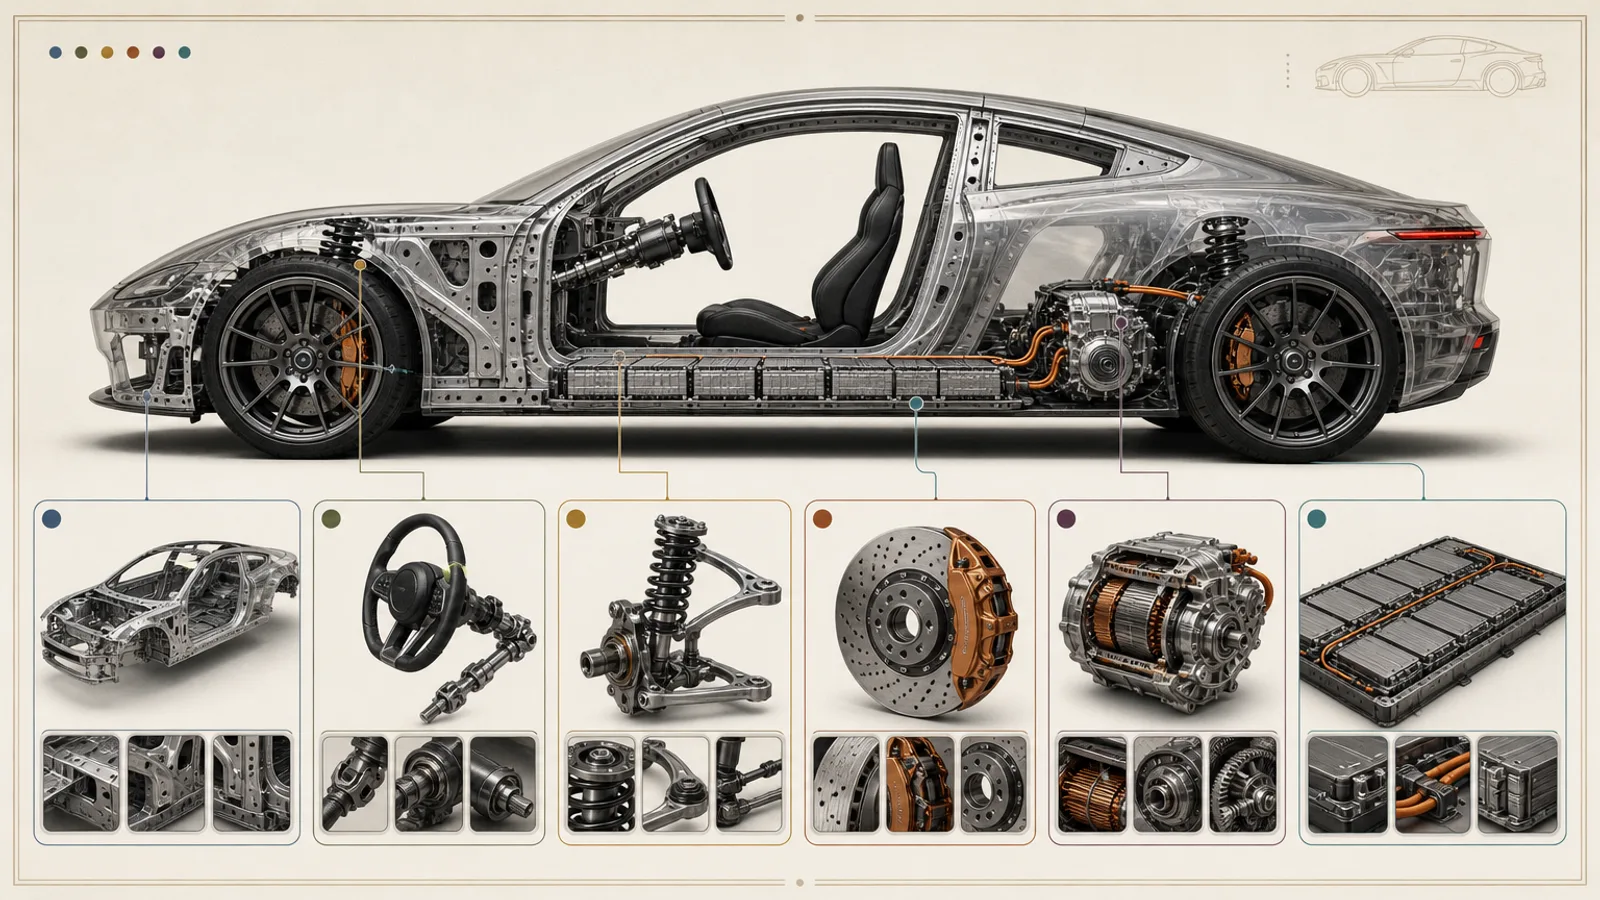
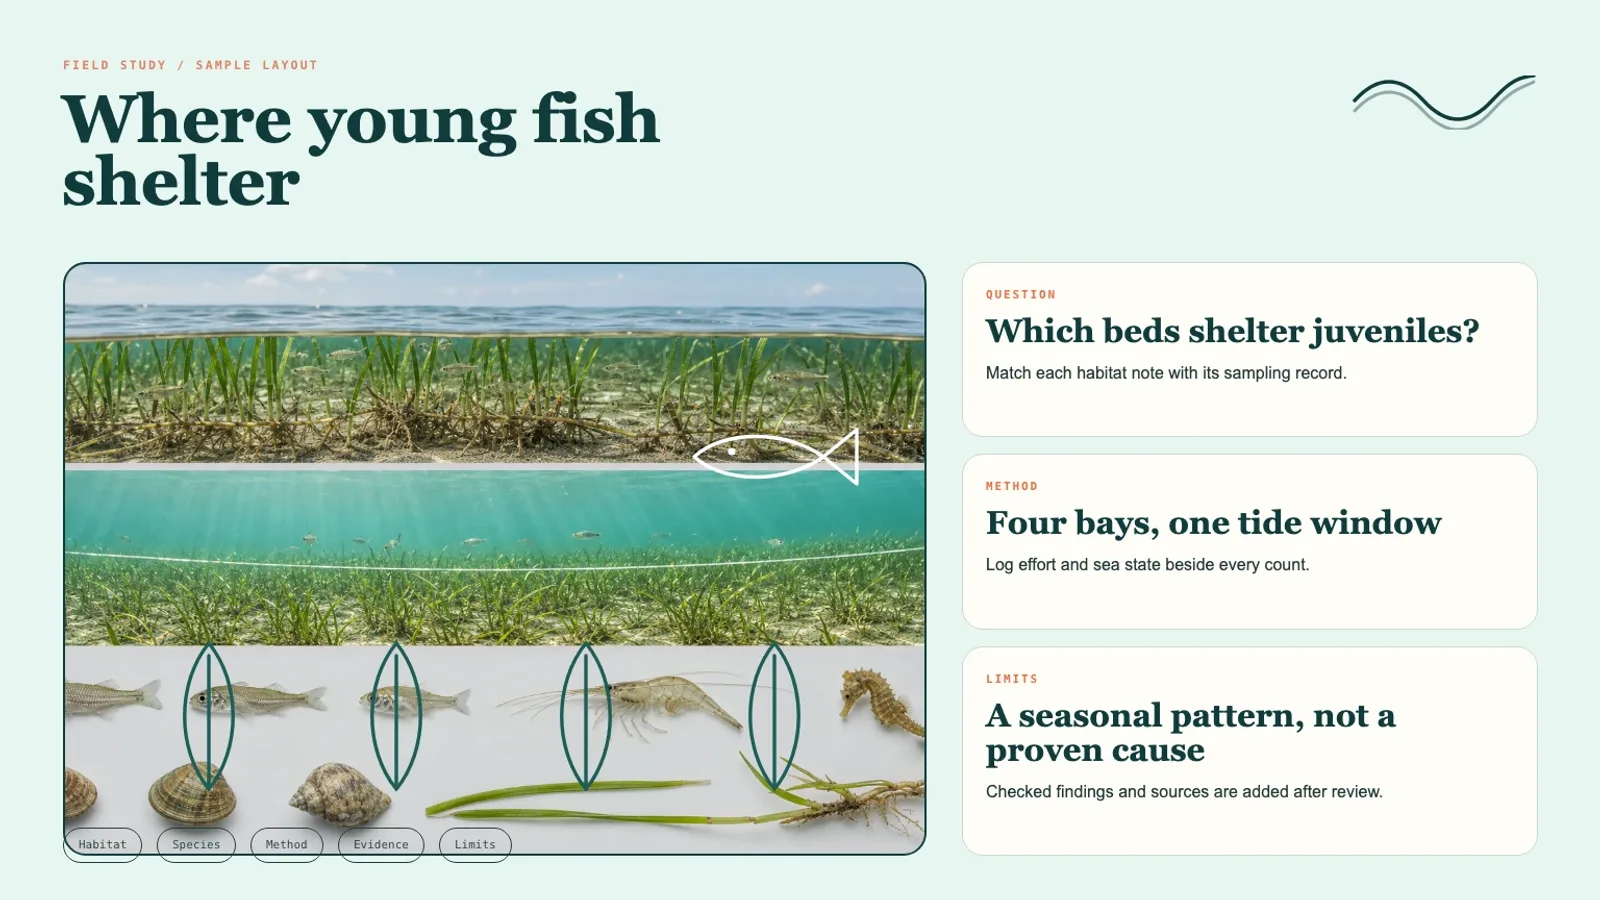
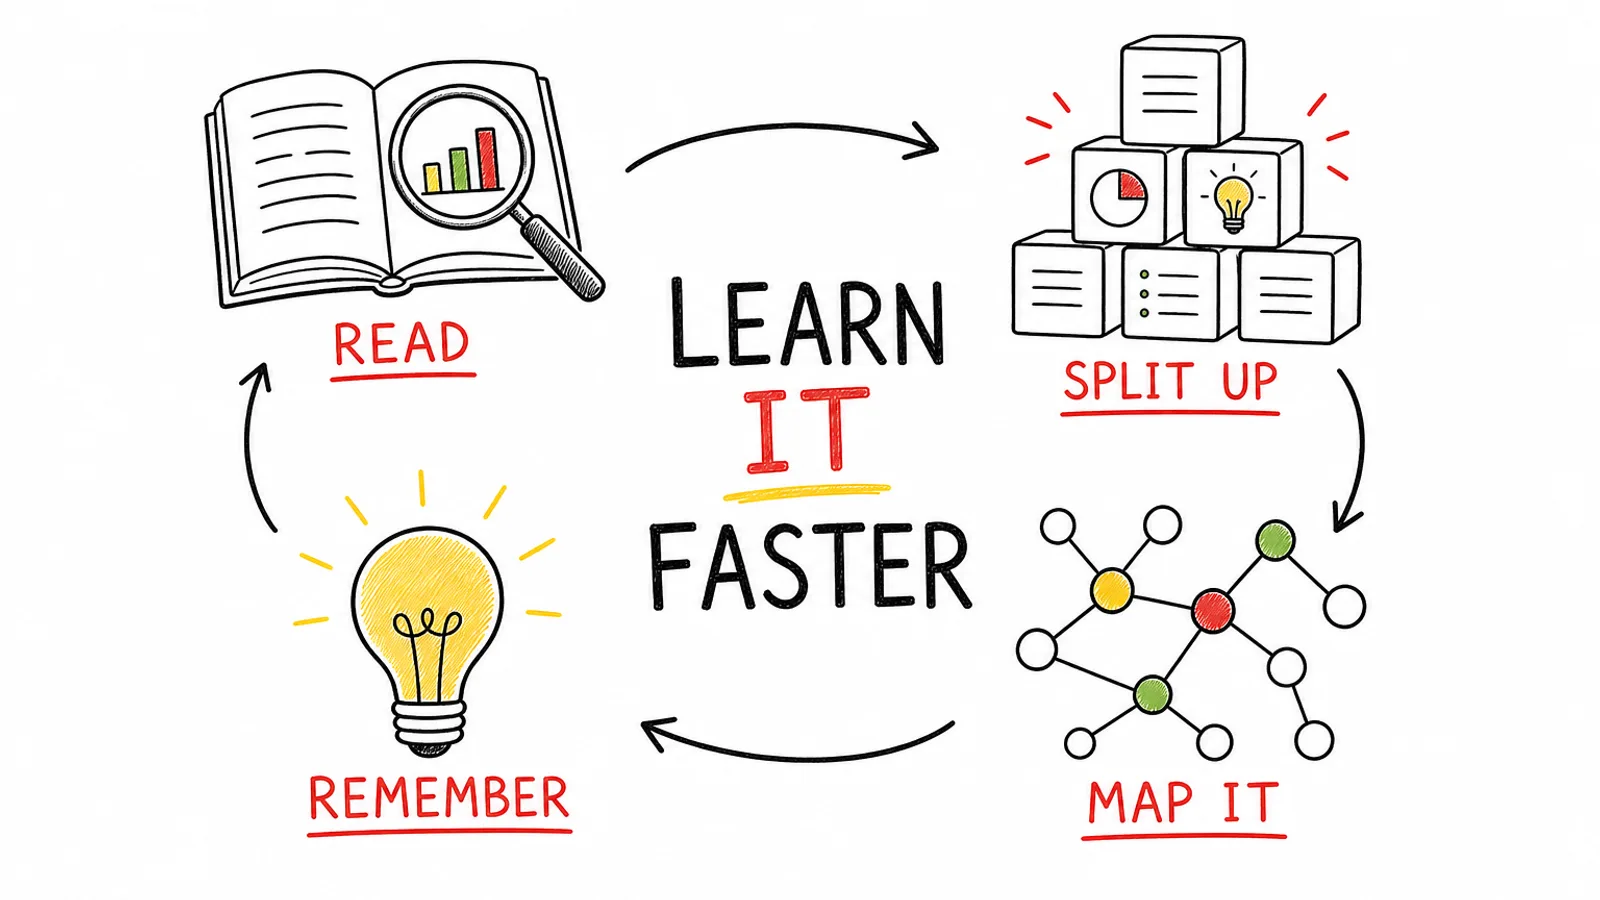
What you get
- Three 16:9 PNG atlas layouts (1536×864) showing only the regions you need
- Comparable small profile charts, all drawn to one scale
- Space for sources, legend and uncertainty notes, plus the evidence table
Good fit
- Teachers preparing a geography or food-culture lesson visual
- Analysts comparing sourced regional data in a single picture
- Science communicators presenting sensory research to the public
Not for
- Scores guessed from reputation or with no source behind them
- Presenting a taste profile as a universal truth
- Sensitive borders that have not had a cartographic review
About this Skill
Comparing coffee origins, spice traditions or regional cheeses? Give the agent a list of regions with stable IDs, comparable measures with citations, an approved base map and projection, and what the legend must say. The sample draws a hand-illustrated world map on warm parchment: eight regions tinted terracotta, ochre and olive, each tied by a thin line to a numbered radar chart, with a flavor key, a source box and spices in the corners. Every chart shares one scale, gaps are marked openly, and a single paid call produces three PNG layouts at 1536×864.
How it works
- Normalize region names, measures, scales, dates and sources into a single table.
- Include just the regions the message needs and choose a projection that fits the map's extent.
- Hold every small chart to the same scale, and flag missing or non-comparable data in plain view.
- Generate the visual system unlabeled, then set every name and number from the verified table.
- Before handover, review borders, contested areas, units, legend mapping and chart scales.
Checked before delivery
- Three separate 16:9 images with no unexpected logo, watermark or protected design
- Structure, order, counts and visual claims match the approved input table
- Exact labels, figures, citations and disclaimers are typeset after generation in a layout tool
- The images are delivered with the final evidence table and the unresolved points
What you need before you start
- You bring
- The list of regions, each with an ID that does not change · Measures and scales that can be compared, with their source citations · The approved base map and its projection · The audience, what the legend must show, and the notes on uncertainty
- Dependencies
- Your FAL account, with FAL_KEY set · Node.js 20 or later
- Outside costs
- FAL_KEY
- Last tested
- v1.0.1 — Claude Code / Codex / Cursor
User reviews
Loading reviews…
FAQ
What data does the atlas need?
Regions with IDs that never change, comparable measures and scales backed by citations, a base map you have approved along with its projection, and the audience, legend contents and uncertainty notes. Anything absent is flagged or left as a visible placeholder rather than quietly filled.
Are names and values painted into the art?
No. The generated map leaves clean areas, and place names, values, references and disclaimers are typeset from the checked table once you pick a composition.
Does the map settle what a region tastes like?
No. It shows the dataset you supplied. Taste is presented as a sourced profile with its method named, not as a universal fact, and sensitive borders get a cartographic disclaimer.